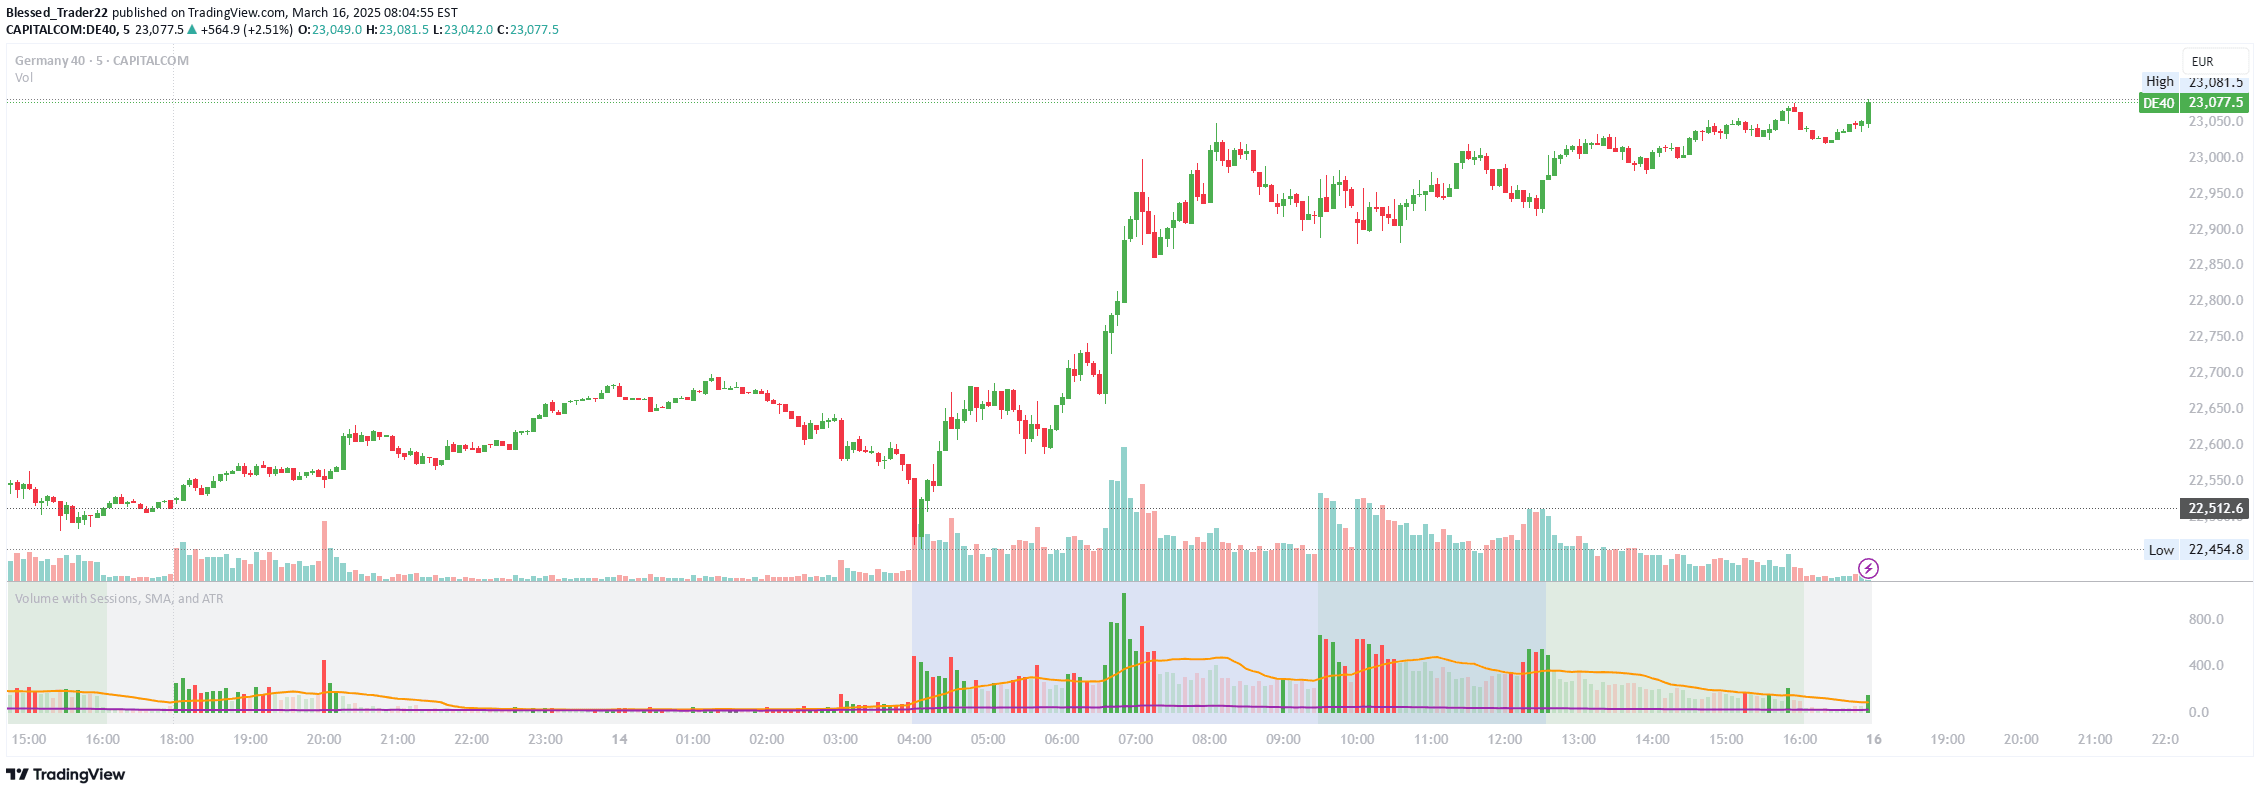
VWAP slope indicator that calculates and visualizes the Volume Weighted Average Price trend direction through color-coded slope analysis, helping traders identify market momentum.
Explore complementary indicator rolesHow it works
The VWAP slope indicator calculates the Volume Weighted Average Price by integrating price and trading volume across a specified timeframe. It determines the slope by comparing the current VWAP value with its historical value from a user-defined lookback period, revealing the market's directional momentum.
By computing this differential, the indicator generates a visual representation of price trend, using color coding to instantly communicate market direction. A green slope indicates an upward trend, suggesting bullish momentum, while a red slope signifies a downward trend, highlighting potential bearish market conditions.
Why it may be useful
The VWAP slope indicator provides traders with a nuanced understanding of market dynamics by combining price and volume data into a single, intuitive metric. It offers a more comprehensive view of market trends compared to traditional price-only analysis, helping traders make more informed decisions about potential entry and exit points.
By translating complex price-volume relationships into a simple, color-coded visualization, the indicator reduces cognitive load and enables faster, more confident trading responses. Traders can quickly assess market sentiment and potential trend reversals without extensive manual calculations.
When to explore it
The VWAP slope indicator is most effective in liquid, high-volume markets where price and volume data provide meaningful insights into market sentiment. It performs particularly well in intraday trading scenarios, such as stock, forex, and futures markets, where rapid trend identification can lead to profitable trading opportunities.
Traders should use this indicator in conjunction with other technical analysis tools to confirm signals and minimize false trend interpretations. It is especially useful during periods of market volatility, helping traders navigate uncertain market conditions and make more strategic trading decisions.
Keep exploring
What we’ve verified
Access, alerts and repainting behaviour have not been independently verified for this indicator. Check the creator’s current publication and settings.
General descriptions and classifications are recovered research. Verified details above identify the specific checks we have completed. Check the creator’s current publication for later changes.