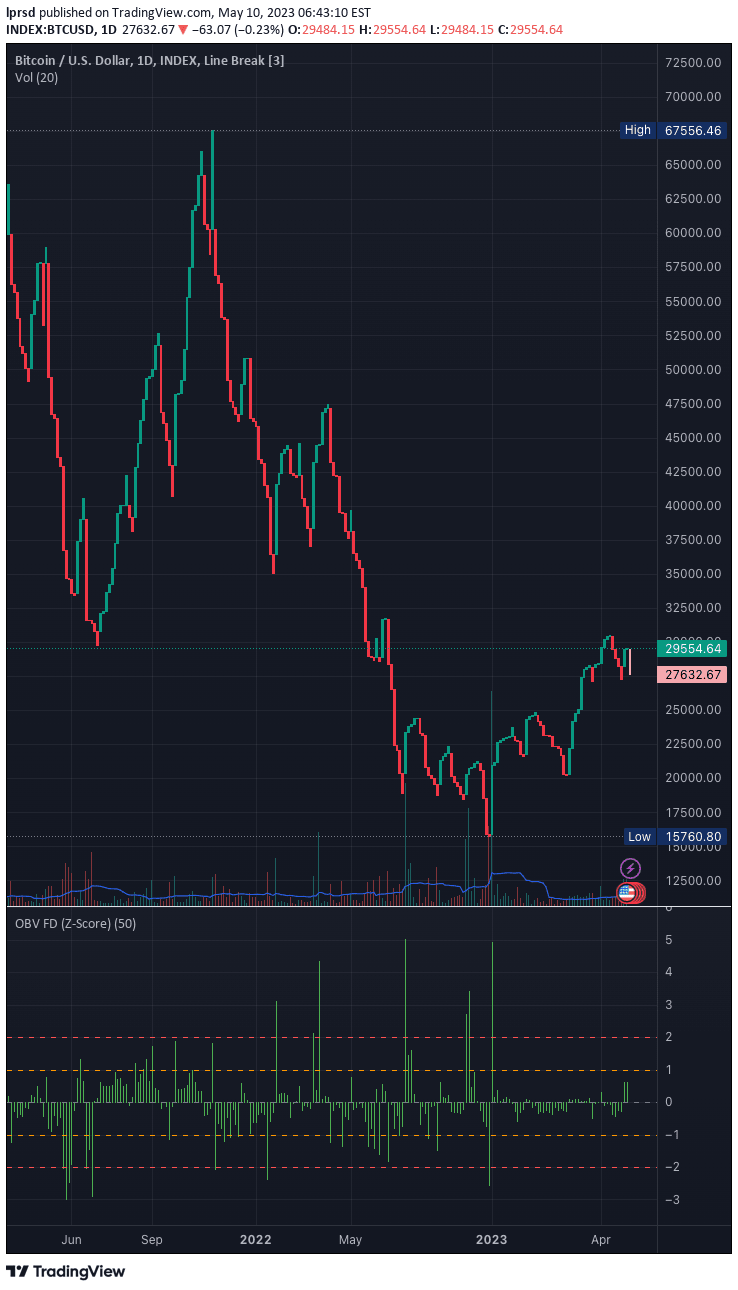
Z-Score(Slope(OBV)) is a trading indicator that analyzes money flow through On Balance Volume to predict local price extremes by measuring volume momentum statistically.
Explore complementary indicator rolesHow it works
The Z-Score(Slope(OBV)) indicator combines three key statistical and technical analysis components: On Balance Volume (OBV), slope calculation, and Z-score transformation. OBV tracks volume flow by adding volume when prices close higher and subtracting volume when prices close lower, creating a cumulative volume indicator that reflects market sentiment.
The indicator then calculates the slope of OBV, representing its rate of change, and applies a Z-score statistical method to understand how the current OBV slope deviates from its historical mean. By transforming the slope into standard deviation units, traders can identify extreme volume momentum conditions that might signal potential price reversals.
Why it may be useful
This indicator provides traders with a sophisticated method to analyze market liquidity and potential price extremes by integrating volume analysis with statistical measurement. It offers a more nuanced approach to understanding market dynamics beyond traditional volume indicators, helping traders identify moments of significant money flow.
By quantifying volume momentum through Z-score analysis, the indicator helps traders recognize when an asset might be experiencing unusual buying or selling pressure. This can provide early warning signals for potential trend reversals or continuation, making it a valuable tool for strategic decision-making in various market conditions.
When to explore it
The Z-Score(Slope(OBV)) indicator works best in markets with clear trends and significant volume activity, such as major stock indices, forex pairs, and liquid commodities. It is particularly effective when combined with line break charts, which help visualize price changes without time constraints and enhance the indicator's trend identification capabilities.
Traders should consider using this indicator during periods of market transition, when volume momentum shows significant deviation from historical norms. It is most reliable when used in conjunction with other technical analysis tools to confirm potential entry or exit points, reducing the risk of false signals.
Keep exploring
What we’ve verified
Access, alerts and repainting behaviour have not been independently verified for this indicator. Check the creator’s current publication and settings.
General descriptions and classifications are recovered research. Verified details above identify the specific checks we have completed. Check the creator’s current publication for later changes.