
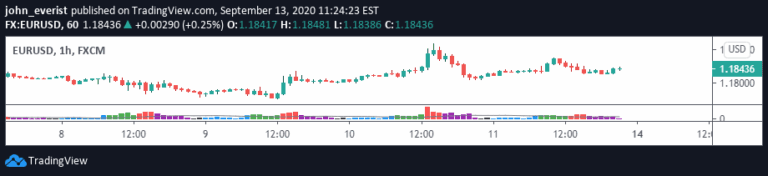
Volume by Session
A volume indicator that separates trading volume by market session, comparing each session's volume to its historical average to provide context-specific volume analysis.
Explore 11,183 indicators. Filter beyond the obvious.
Discover the tools that fit the way you trade.
11,183 tools to explore
A volume indicator that separates trading volume by market session, comparing each session's volume to its historical average to provide context-specific volume analysis.
A currency strength indicator that compares major and cross currencies relative to each other, helping traders understand underlying market dynamics and identify potential trading opportunities.
A trading signal analyzing Commercials' positioning in the Commitment of Traders (COT) report, revealing market sentiment through percentile-based range measurements.
A comprehensive pivot point indicator that identifies support and resistance levels across multiple timeframes, helping traders understand potential price reversals and breakout opportunities.
A comprehensive support and resistance indicator using Central Pivot Range and Lagging Span to identify key price levels and trading opportunities across multiple timeframes.
A custom indicator that calculates the relative strength of eight major currencies by analyzing their 20-period Simple Moving Average (SMA) direction and price positioning.
A Pine Script tool for exporting comprehensive candlestick data from TradingView charts, providing real-time OHLC and volume information with easy CSV export capabilities.
MERCURYPRO is a dynamic technical analysis tool that combines Chande Momentum Oscillator and Standard Deviation to provide trend signals and momentum insights for traders.
A TradingView script tracking planetary retrograde periods, dynamically visualizing cosmic cycles and their potential market influences through color-coded background and real-time status table.
Likes, views, and comments are historical TradingView snapshots. They describe attention, not trading performance.