Setup 123 Scalper
A trading setup identifying potential buy or sell opportunities based on a three-candle pattern where the second candle has the lowest or highest price point, focusing on trending assets.
Explore 11,183 indicators. Filter beyond the obvious.
Discover the tools that fit the way you trade.
11,183 tools to explore
A trading setup identifying potential buy or sell opportunities based on a three-candle pattern where the second candle has the lowest or highest price point, focusing on trending assets.
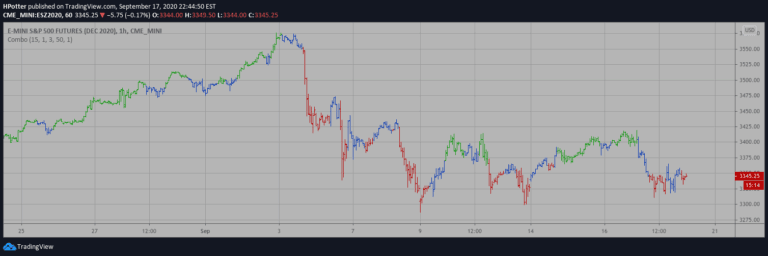
A combo trading strategy combining price action and stochastic oscillator signals to identify market trends and potential entry/exit points using two distinct analytical approaches.
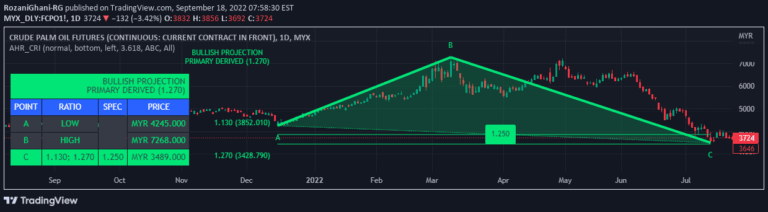
A harmonic trading indicator based on Scott Carney's method that uses Fibonacci ratios to identify potential price reversal zones and trading patterns through precise point-based analysis.
A price action indicator that combines previous day's high/low levels with a three-candle pattern analysis to identify potential market reversals or continuations.
A comprehensive market overview indicator tracking 10 key indices and stocks, providing detailed price and percentage change data across multiple timeframes.
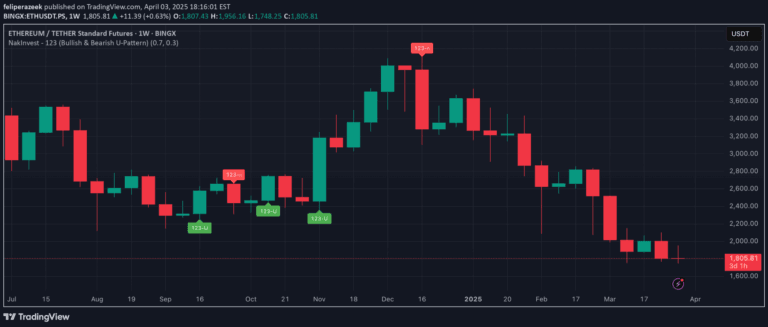
The 123 pattern is a powerful candlestick formation that identifies potential trend reversals by analyzing three consecutive candles, revealing bullish or bearish market sentiment shifts.
A multi-timeframe RSI indicator that identifies market trends and potential entry/exit points by analyzing monthly, weekly, and daily RSI levels for more reliable trading signals.
A utility script for futures traders to precisely calculate position size based on risk tolerance, helping traders quickly determine contract size and validate risk-reward ratio.
The Sharpe Ratio Indicator evaluates an asset's risk-adjusted performance by comparing its returns to the risk-free rate and measuring excess return per unit of volatility.
The Omega Ratio Indicator measures risk-adjusted performance by analyzing the probability of achieving a target return, providing a comprehensive view of an asset's performance relative to risk.
A trading tool that helps calculate weighted average entry price across multiple investment points and tracks potential profit targets for strategic asset management.
A custom indicator tracking global money supply percentage across major economies, providing insights into global liquidity trends and potential market movements through normalized M2 data.
Likes, views, and comments are historical TradingView snapshots. They describe attention, not trading performance.