Trend Type Indicator by BobRivera990
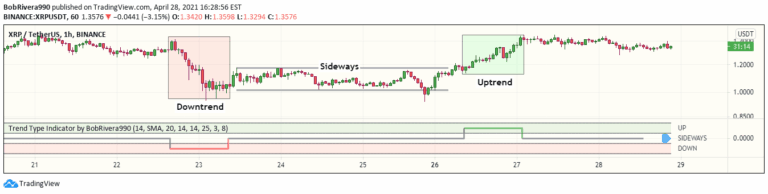
A technical analysis signal that uses ATR and ADX to detect market trends, distinguishing between uptrend, downtrend, and sideways movements by analyzing price volatility and directional momentum.
Explore 11,183 indicators. Filter beyond the obvious.
Discover the tools that fit the way you trade.
11,183 tools to explore
A technical analysis signal that uses ATR and ADX to detect market trends, distinguishing between uptrend, downtrend, and sideways movements by analyzing price volatility and directional momentum.
The Bollinger Band Width Percentile measures relative volatility by calculating the percentage of historical periods where Bollinger Band width was narrower than the current period.
An advanced trading strategy identifying Fair Value Gaps (FVGs) within specific market session periods to detect potential intraday trading opportunities and key price levels.
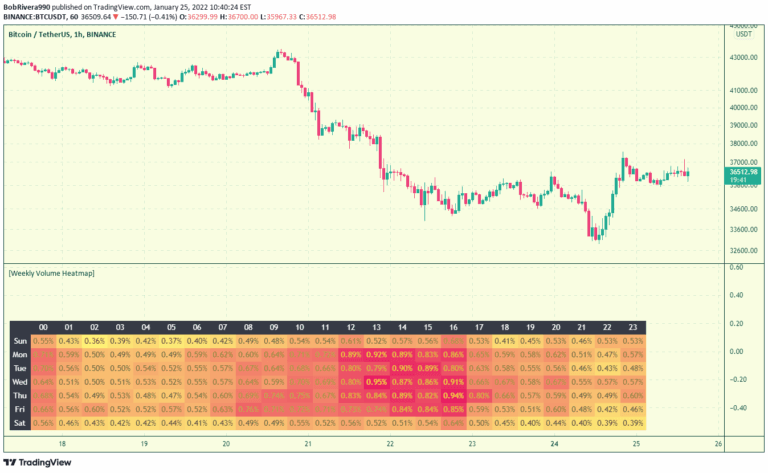
A trading tool that visualizes asset trading volume variations across different times of the week, helping traders understand market liquidity and optimal trading periods.
A trading indicator that plots high/low levels for key trading sessions and identifies RTH opening gaps, providing potential entry and exit areas for traders.
A trading approach that divides the day into quarters and 90-minute cycles, analyzing market phases of Accumulation, Manipulation, Distribution, and Rebalance.
Liquidity indicator that identifies key pivot point levels, showing potential trade targets and reversal points by tracking resting orders and highlighting breakthrough zones.
A trading indicator that analyzes the relationship between current and previous price candles, providing insights into potential market direction and momentum through price action analysis.
An ICT-based indicator that plots multiple gap and volume imbalance levels across different timeframes, helping traders identify potential price magnets and trading opportunities.
Order Blocks are significant price levels that act as potential support or resistance, identifying key zones where price may react or reverse based on the ICT trading system.
A 90-minute cycle trading concept focusing on specific time windows during global market sessions, helping traders identify potential price movements within predefined timeframes.
A dynamic trading system dividing market time into four quarterly phases, using fractal time analysis to identify optimal entry and exit points across different market conditions.
Likes, views, and comments are historical TradingView snapshots. They describe attention, not trading performance.