Power Of 3 ICT 01 [TradingFinder] AMD ICT & SMC Accumulations
A time-based trading indicator dividing the market day into three phases: Accumulation, Manipulation, and Distribution, helping traders understand institutional trading strategies.
Explore 11,183 indicators. Filter beyond the obvious.
Discover the tools that fit the way you trade.
11,183 tools to explore
A time-based trading indicator dividing the market day into three phases: Accumulation, Manipulation, and Distribution, helping traders understand institutional trading strategies.
A price action-based indicator designed for GridBots that identifies potential market reversals after sustained price movements, helping traders recognize entry points for short or long trades.
A trading approach that divides the day into quarters and 90-minute cycles, analyzing market phases of Accumulation, Manipulation, Distribution, and Rebalance.
AMDX strategy divides the trading day into four distinct phases, providing a structured approach to understanding market behavior and institutional trading patterns.
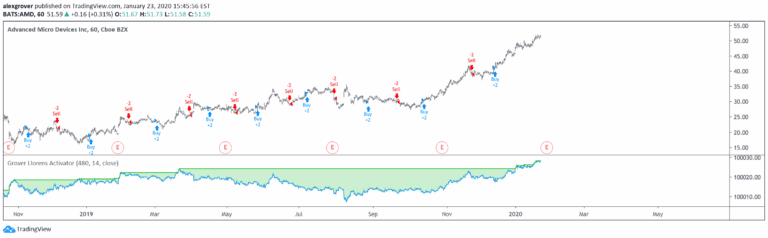
The Grover Llorens Activator is a trailing stop indicator inspired by parabolic SAR, designed to provide early exit points and trend reversal detection using adaptive convergence techniques.
A candlestick-based trading indicator that identifies engulfing patterns to predict potential price reversals and trading zones using visual lines and areas on the chart.
A power cycle indicator identifying potential market manipulations or reversals by tracking candle sweeps and range closures, designed to highlight strategic entry points.
A versatile trading indicator that divides market sessions into four quarters, analyzing price behavior and potential market movements across different trading timeframes.
AMDX/XAMD indicator highlights specific trading sessions with customizable colors and styles, dividing the trading day into four distinct market phases for analysis.
A dynamic trading system dividing market time into four quarterly phases, using fractal time analysis to identify optimal entry and exit points across different market conditions.
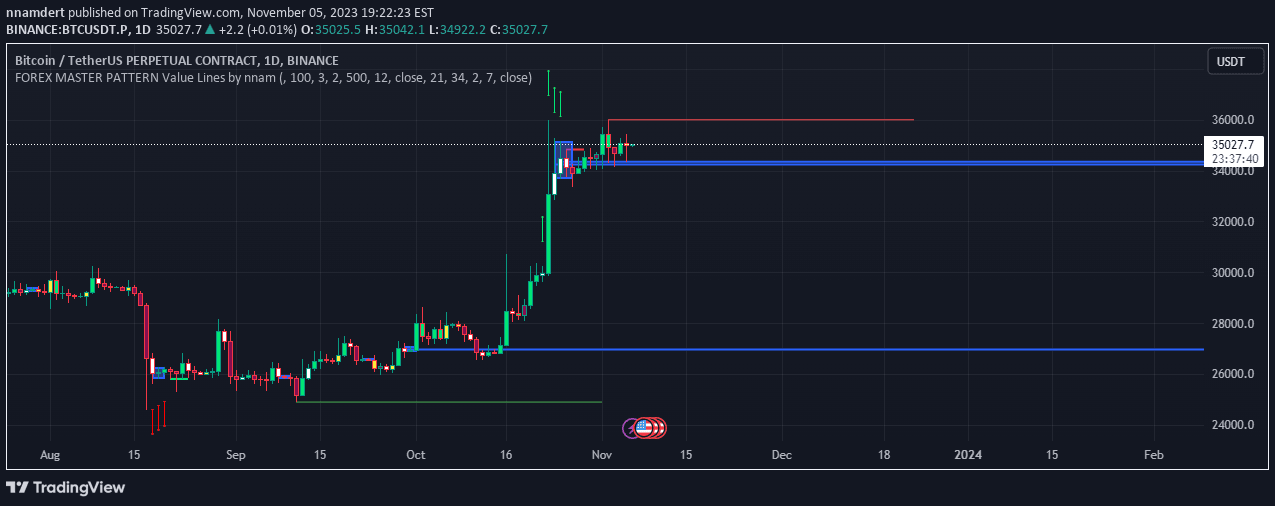
A Forex technical analysis tool that identifies hidden price patterns and contraction points, helping traders spot potential market movements and institutional trading strategies.
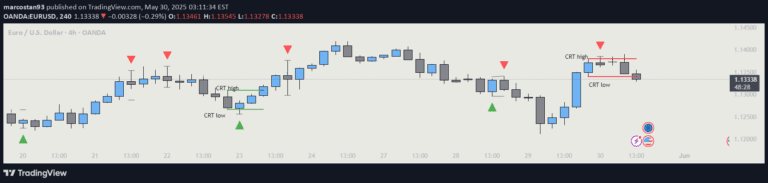
A trading indicator that identifies potential market reversals or continuations by analyzing two consecutive candle patterns and generating visual signals with triangular markers.
Likes, views, and comments are historical TradingView snapshots. They describe attention, not trading performance.