YOUR INDICATOR RESEARCH STARTS HERE

Find the right indicator.
Understand what it does.

Explore 11,183 indicators. Filter beyond the obvious.
Discover the tools that fit the way you trade.

THE INDICATOR LIBRARY

Results for “Cumulative Volume Index (CVI)”

11,183 tools to explore

14 indicators matching your filters
Save search
MomentumOscillatorVolume

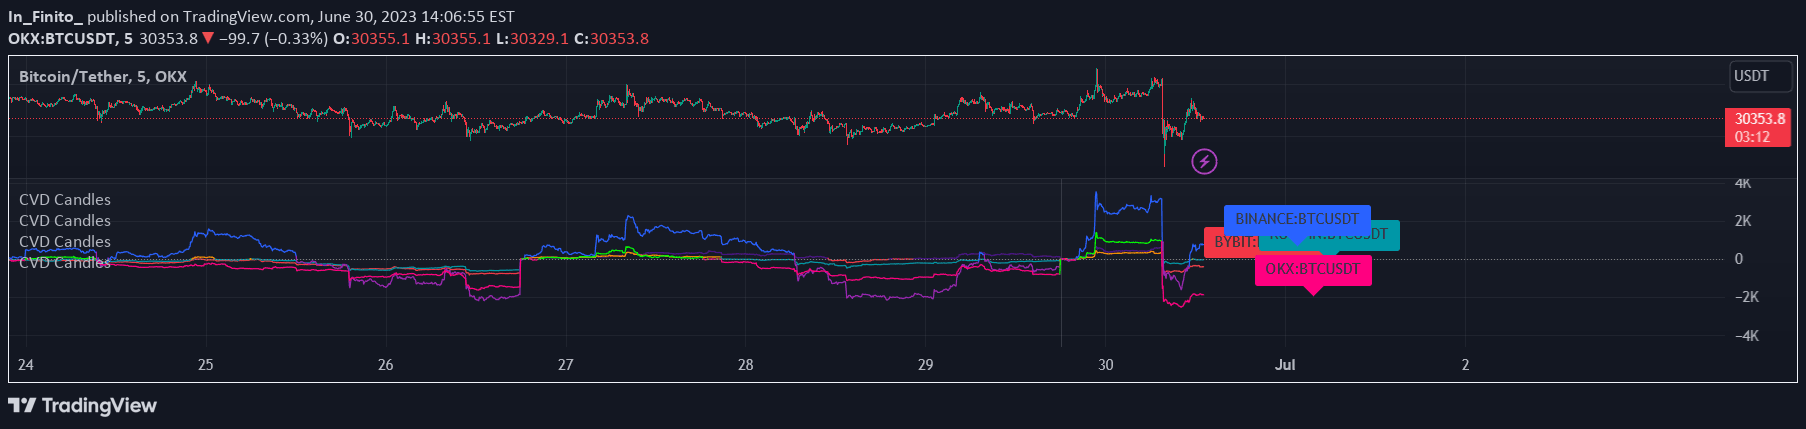
CVD Oscillator

by mindyourbuisness

A volume-based momentum oscillator that measures buying and selling pressure by analyzing how volume interacts with price, revealing potential trend shifts and market control dynamics.

Separate pane · unverifiedScalping · Day Trading
Explore
312likes7.3Kviews2comments
Save
Volume

BTC ETF Volumes

by Powerscooter

A comprehensive volume tracking script for Bitcoin spot ETFs that visualizes individual and aggregate trading volumes across different ETF instruments.

Separate pane · unverifiedScalping · Day Trading
Explore
188likes4.3Kviews1comments
Save
SignalVolume

Footprint Chart by Th16rry

by Th16rry

A TradingView approximation of a Footprint Chart that estimates buy and sell volume distribution for each candlestick, providing insights into market order flow dynamics.

Main price chart · unverifiedScalping · Day Trading
Explore
102likes5Kviews0comments
Save
OscillatorVolume

CVD Oscillator - Short Term SwiftEdge

by SwiftEdge

A short-term technical indicator measuring buying and selling pressure through Cumulative Volume Delta (CVD), providing traders with a normalized oscillator to assess market momentum across low timeframes.

Separate pane · unverifiedScalping · Day Trading
Explore
95likes3.2Kviews0comments
Save
LevelsSignalTrend

MVRV Ratio - R.Bonaldi

by Bonaldi007

MVRV Ratio helps traders assess cryptocurrency valuation by comparing market value to realized value, identifying potential buying and selling opportunities.

Separate pane · unverifiedScalping · Day Trading
Explore
77likes3.2Kviews2comments
Save
SignalVolume

Daily Buy/Sell Volume

by GabboG_

A daily trading volume indicator that separates buy and sell volumes by comparing opening and closing prices, providing visual insights into market sentiment and trading activity.

Separate pane · unverifiedScalping · Day Trading
Explore
31likes1.2Kviews0comments
Save

Likes, views, and comments are historical TradingView snapshots. They describe attention, not trading performance.

START WITH A QUESTION

A little less searching.
A lot more understanding.

Tell DeepAlpha what you need. Get an explanation, a shortlist,
and a direct path to the indicators behind it.

Ask DeepAlpha