Live Economic Calendar by toodegrees
Live Economic Calendar tracks global financial news events, providing real-time updates on market-moving events across multiple currencies with impact levels and detailed visualizations.
Explore 11,183 indicators. Filter beyond the obvious.
Discover the tools that fit the way you trade.
11,183 tools to explore
Live Economic Calendar tracks global financial news events, providing real-time updates on market-moving events across multiple currencies with impact levels and detailed visualizations.
Global Monetary Supply M2 tracks the monetary volume of the world's richest and most populous countries, measuring currency liquidity in USD.
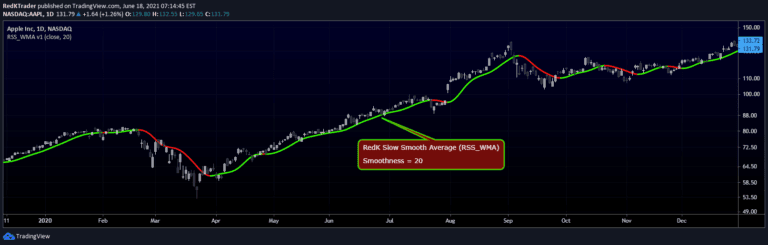
RedK Slow Smooth Average (RSS_WMA) is a specialized moving average designed to provide smooth trend visualization by filtering out short-term price noise through multiple weighted moving average passes.
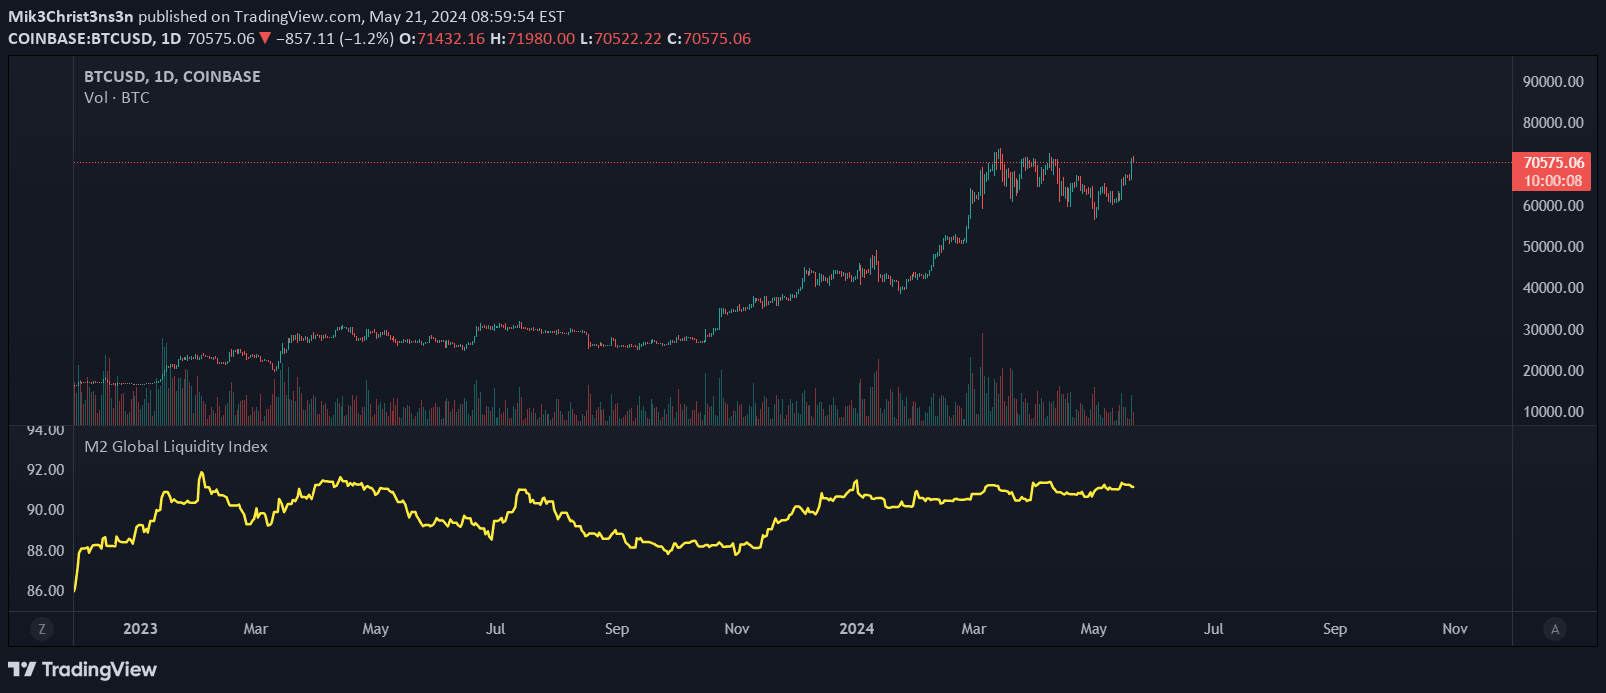
The M2 Global Liquidity Index tracks aggregate money supply across five major currencies, providing a comprehensive view of global economic liquidity and potential market trends.
TrendWave Bands is an adaptive trend-following indicator that uses dynamic color-gradient bands to highlight market trends, providing visual insights into trend direction, strength, and duration.
A currency strength indicator that measures relative performance of currencies by comparing their exchange rates and tracking their strength over time using a specialized meter and scatter plot.
Global Net Liquidity tracks total central bank assets across major economies, providing a comprehensive view of monetary conditions and potential market impacts.
An advanced volume analysis tool for crypto trading that aggregates volume data across multiple exchanges, offering customizable volume calculation and display methods.
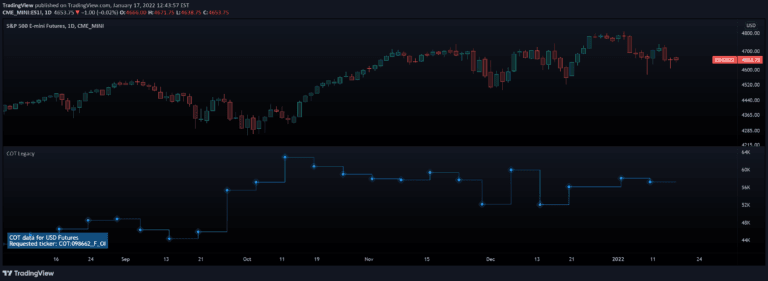
Commitment of Traders (COT) indicator provides insights into futures market positions by tracking open interest, trader classifications, and market participation across different exchanges.
A currency strength indicator that compares major and cross currencies relative to each other, helping traders understand underlying market dynamics and identify potential trading opportunities.
COT index reveals market sentiment by tracking net positioning of smart money traders in futures markets over a 26-week period using data from the Commodity Futures Trading Commission.
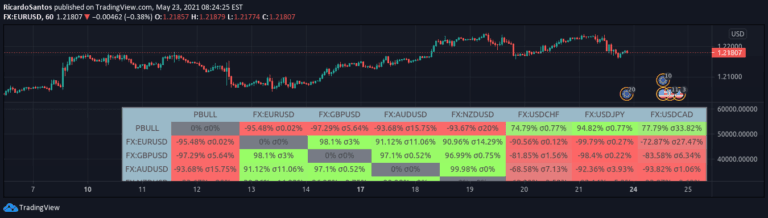
A Correlation Matrix utilizes statistical tables to analyze relationships between different financial variables, helping traders understand interconnected market behaviors and potential predictive patterns.
Likes, views, and comments are historical TradingView snapshots. They describe attention, not trading performance.