
YOUR INDICATOR RESEARCH STARTS HERE

Find the right indicator.
Understand what it does.

Explore 11,183 indicators. Filter beyond the obvious.
Discover the tools that fit the way you trade.

THE INDICATOR LIBRARY

Results for “GEOMETRIC”

11,183 tools to explore

123 indicators matching your filters
Save search
TrendEditor’s pick

Auto Chart Patterns [Trendoscope®]

by Trendoscope

An advanced algorithmic indicator that automatically identifies and classifies complex chart patterns by analyzing trend lines, pivot points, and geometric formations across multiple timeframes.

Main price chart · unverifiedSwing Trading
Explore
12.9Klikes341.3Kviews128comments
Save
TrendMomentumEditor’s pick

Fibonacci Time-Price Zones

by xxattaxx

Fibonacci Time-Price Zones is an advanced indicator that combines Fibonacci ratios with time and price analysis, offering multiple geometric visualization methods to identify market turning points.

Main price chart · unverifiedDay Trading · Swing Trading
Explore
5.2Klikes147.5Kviews33comments
Save
TrendMomentumEditor’s pick

Multi ZigZag Harmonic Patterns

by Trendoscope

A comprehensive harmonic pattern recognition tool that identifies multiple chart patterns using zigzag indicators, helping traders detect potential trend reversals and continuation signals.

Main price chart · unverifiedDay Trading · Swing Trading
Explore
4.5Klikes134.5Kviews111comments
Save
TrendMomentumEditor’s pick

[JRL] MM Fibonacci

by JRL_6

A unique trading indicator combining Murrey Math formulas with Fibonacci retracement levels to identify potential market tops, bottoms, and long-term trend dynamics with enhanced precision.

Main price chart · unverifiedSwing Trading
Explore
4.4Klikes80.6Kviews60comments
Save
LevelsPatternsSignal

Three Drive Pattern Detector [LuxAlgo]

by LuxAlgo

A harmonic pattern detection indicator that identifies Three Drives patterns using multi-length swing detection and Fibonacci ratios to spot potential market reversals.

Main price chart · unverifiedScalping · Day Trading
Explore
4.3Klikes34.3Kviews13comments
Save
TrendMomentumEditor’s pick

Gann Box (Zeiierman)

by Zeiierman

The Gann Box is a technical analysis tool that uses geometric principles to identify potential support and resistance levels, forecast price movements, and analyze market trends.

Main price chart · unverifiedDay Trading · Swing Trading
Explore
3Klikes97.3Kviews58comments
Save
TrendMomentumEditor’s pick

Gann Square of 144

by ThiagoSchmitz

A technical analysis tool based on W.D. Gann's Square of 144, helping traders identify potential price targets, support, and resistance levels through geometric price and time calculations.

Main price chart · unverifiedSwing Trading
Explore
2.6Klikes102.3Kviews54comments
Save
TrendMomentumEditor’s pick

Swing High/Low Anchored Spiral

by alexgrover

An innovative trading signal that fits an Archimedean spiral to price action, allowing traders to visualize price movement through a unique geometric representation with customizable parameters.

Main price chart · unverifiedSwing Trading
Explore
2.2Klikes97.8Kviews32comments
Save
TrendSignalPatterns

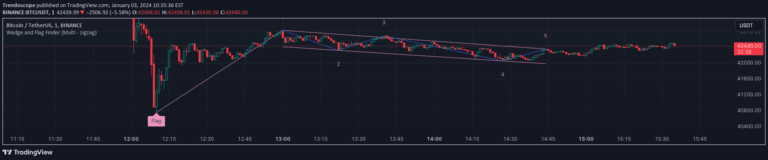
Flags and Pennants [Trendoscope®]

by Trendoscope

Chart pattern analysis focusing on flag and pennant formations that identify potential trend continuation after strong impulse waves, helping traders anticipate market momentum.

Main price chart · unverifiedScalping · Day Trading
Explore
1.7Klikes24.3Kviews13comments
Save

Likes, views, and comments are historical TradingView snapshots. They describe attention, not trading performance.

START WITH A QUESTION

A little less searching.
A lot more understanding.

Tell DeepAlpha what you need. Get an explanation, a shortlist,
and a direct path to the indicators behind it.

Ask DeepAlpha

