Range Detector [LuxAlgo]
A dynamic range detection indicator that identifies price consolidation zones, highlights range extremities, and signals potential breakouts using real-time color-coded markers.
Explore 11,183 indicators. Filter beyond the obvious.
Discover the tools that fit the way you trade.
11,183 tools to explore
A dynamic range detection indicator that identifies price consolidation zones, highlights range extremities, and signals potential breakouts using real-time color-coded markers.
A predictive indicator that estimates future trading ranges by providing dynamic support and resistance levels while helping traders identify price trend directions in real-time.
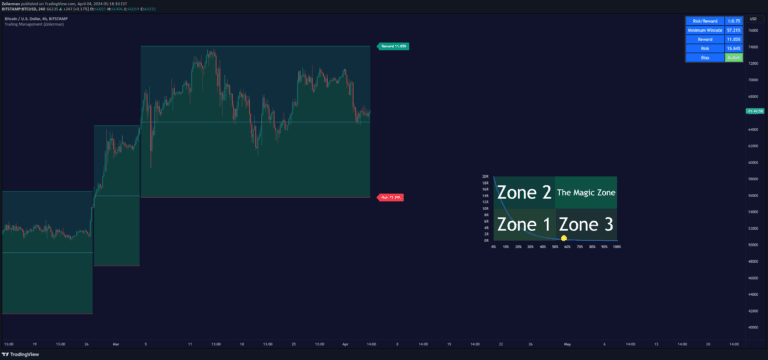
An advanced trading indicator that dynamically manages trailing stops, calculates break-even points, and helps traders optimize risk-reward strategies across different market conditions.
A dynamic range detection indicator that uses ADX and gradient candlesticks to identify market conditions, range boundaries, and potential mean reversion points.
An advanced trading indicator that detects dynamic support and resistance zones using pivot points, geometric moving averages, and real-time price action analysis to help traders identify potential market movements.
Zero-lag TEMA Crosses is a technical indicator that reduces moving average lag by using Triple Exponential Moving Average (TEMA) calculation to identify faster trend changes.
An advanced trading indicator using Gaussian Moving Average with adaptive volatility and a for-loop scoring mechanism to detect dynamic market trends and potential signal opportunities.
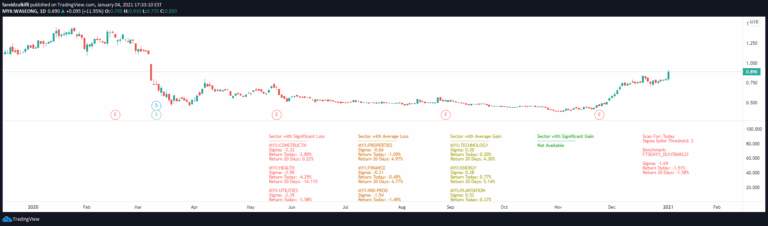
A market analysis tool that measures significant price movements by comparing daily returns to the standard deviation of recent price changes, helping traders identify unusual market activity.
A dynamic band system that adapts to market volatility using standard deviation and average daily range, providing responsive price expansion and breakout detection.
An advanced market analysis technique measuring the Open Price Range (OPR) and filtering trades based on daily volatility, identifying potential trading opportunities early in the day.
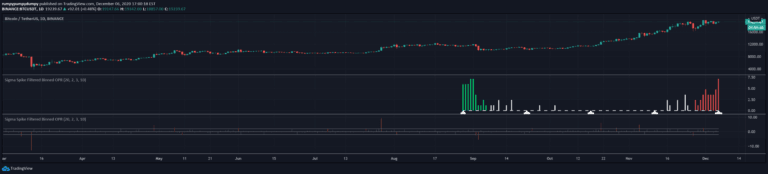
A statistical method for identifying significant price movements by detrending time series and comparing candle sizes against a standardized distribution to detect anomalous trading events.
A trading script combining dynamic Fibonacci levels with fractal support and resistance analysis to identify market momentum and potential entry points across multiple timeframes.
Likes, views, and comments are historical TradingView snapshots. They describe attention, not trading performance.