Machine Learning: Gaussian Process Regression [LuxAlgo]
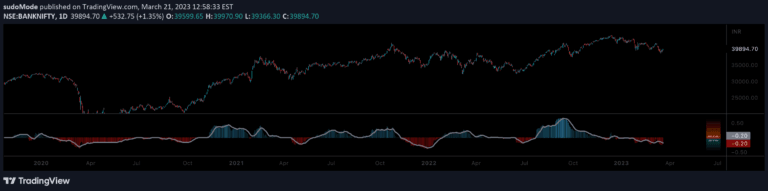
Gaussian Process Regression (GPR) is a machine learning method for forecasting price trends by analyzing recent price observations and estimating underlying market movements.
Explore 11,183 indicators. Filter beyond the obvious.
Discover the tools that fit the way you trade.
11,183 tools to explore
Gaussian Process Regression (GPR) is a machine learning method for forecasting price trends by analyzing recent price observations and estimating underlying market movements.
A sophisticated indicator tracking smart money investor activities versus less informed traders, using RSI-based ratios to identify potential market entry and exit points.
Machine learning indicator using Gaussian Process Regression to estimate market trends and forecast future price movements by analyzing historical price data between two selected anchor points.
A trading indicator that plots key market opening times and prices across multiple timeframes, helping traders identify premium or discounted price levels.
Smart Money Technique Divergence indicator identifies market manipulation and price action patterns by comparing correlated instruments using dual detection across different lookback periods.
A trading indicator that helps identify smart money concepts and ICT practices by providing session-based visual features like bar colors, background colors, and session boundary markers.
A dynamic liquidity indicator that identifies key market zones using swing point analysis, highlighting potential support and resistance levels where significant price action may occur.
An advanced moving average indicator that allows anchoring multiple moving average types to specific time points, enabling dynamic trend and support/resistance analysis.
CISD is an advanced trading indicator that detects liquidity sweeps and institutional market movements, helping traders identify high-probability entry points through smart money concepts.
Equilibrium is a market pressure gauge that measures buying and selling dynamics by analyzing candle lengths and volumes to indicate current market sentiment and potential trend shifts.
NET BSP is a volatility indicator that tracks buying and selling pressure, helping traders understand market balance and potential trend movements by comparing bullish and bearish candle metrics.
A trading tool that identifies Fair Value Gaps (FVGs) and market inefficiencies, helping traders spot potential entry points and liquidity zones based on Inner Circle Trader methodology.
Likes, views, and comments are historical TradingView snapshots. They describe attention, not trading performance.