Market Sentiment Technicals [LuxAlgo]
A comprehensive market sentiment indicator that synthesizes multiple technical analysis techniques into a single value, providing insights into market direction, momentum, and potential trend reversals.
Explore 11,183 indicators. Filter beyond the obvious.
Discover the tools that fit the way you trade.
11,183 tools to explore
A comprehensive market sentiment indicator that synthesizes multiple technical analysis techniques into a single value, providing insights into market direction, momentum, and potential trend reversals.
A dynamic support and resistance indicator that tracks buy and sell power within price zones, helping traders identify potential market reversals and breakout opportunities.
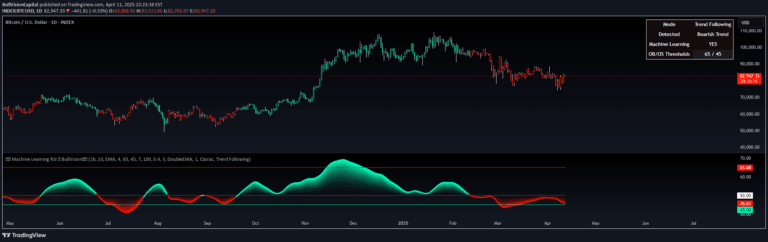
A sophisticated RSI indicator that uses machine learning and K-Nearest Neighbors to dynamically adapt momentum analysis by comparing current market conditions with historical patterns.
Peak Activity Levels indicator identifies support and resistance zones using volume peaks, displaying price levels where significant trading activity occurs and highlighting potential market turning points.
Fair value bands assess price behavior by tracking deviations from a mean basis, helping traders identify normal and abnormal price movements through dynamic statistical bands.
An AI-powered trading indicator using k-Nearest Neighbors algorithm to analyze market trends, predict price movements, and provide intelligent trend navigation for traders.
A trading signal that finds the most similar historical price sequences and projects future price movements using multiple similarity and correlation measures.
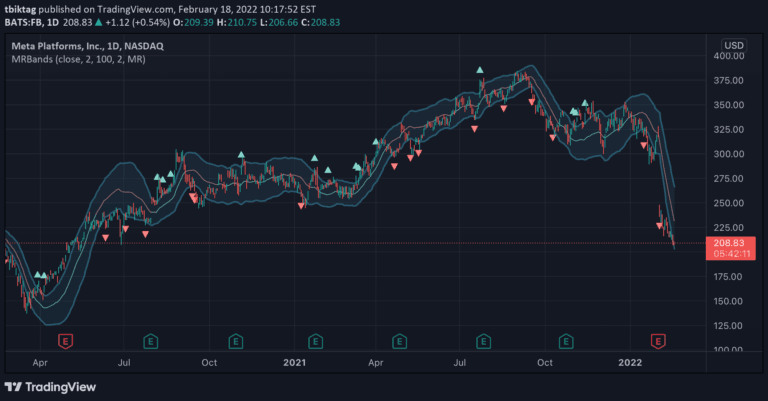
Moving Regression Prediction Bands combine regression analysis and statistical prediction to create a dynamic price prediction channel with upper and lower bands indicating potential price momentum and trend shifts.
A Monte Carlo simulation tool that forecasts potential price ranges using complex pseudorandom generation techniques, providing probabilistic insights into market movement scenarios.
A trading signal that predicts potential choppiness in New York trading sessions by analyzing price behavior during Asian and London sessions, with customizable success tracking.
A technical analysis tool combining MACD and RSI overlaid on price charts, offering traders insights into market momentum, trend direction, and potential trade signals.
A performance evaluation tool that calculates risk-adjusted return metrics like Sharpe, Sortino, and Omega Ratios to help traders assess investment performance and risk.
Likes, views, and comments are historical TradingView snapshots. They describe attention, not trading performance.