Hull Suite
Hull Moving Average (HMA) is an advanced technical indicator designed to minimize lag and provide smooth trend visualization across multiple variants with customizable settings.
Explore 11,183 indicators. Filter beyond the obvious.
Discover the tools that fit the way you trade.
11,183 tools to explore
Hull Moving Average (HMA) is an advanced technical indicator designed to minimize lag and provide smooth trend visualization across multiple variants with customizable settings.
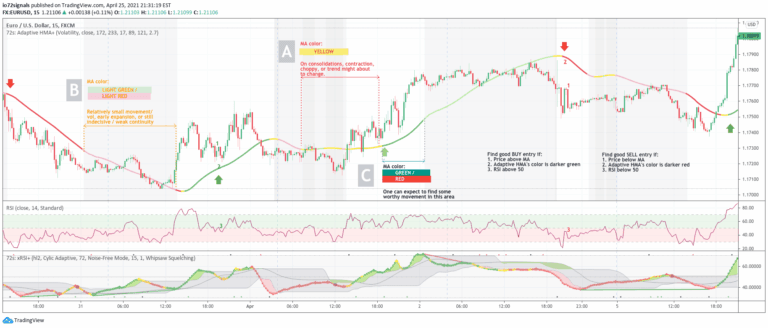
An adaptive Hull Moving Average that dynamically adjusts its period based on volume and volatility, providing clearer trend signals and market condition insights for traders.
A scalping tool for 1-minute charts that filters trend direction and power to minimize false entries, focusing on identifying optimal trading opportunities in market movements.
A dynamic trend-tracking indicator that identifies major trend shifts, maps price impulses, and quantifies trend strength through adaptive volatility envelopes and real-time percentage calculations.
A custom candle indicator using Hull Moving Average (HMA) to reduce market noise and help identify price trends by calculating unique open, high, low, and close values.
A moving average indicator with color-coded trend signals that plots when price crosses the moving average, helping traders identify potential trend reversals and entry points.
A trend strength indicator using Modified Hull Moving Average with a visual gauge that shows trend direction and intensity through color and transparency gradients.
A sophisticated RSI variant using Kalman filter and Hull moving average to create a more adaptive and responsive momentum indicator that reduces noise and tracks price changes dynamically.
Dynamic Trend Bands is a versatile trend-following indicator using double-smoothed Hull Moving Average to detect market trends and provide volatility-based price zones.
A Hull Moving Average-based indicator that identifies key swing points in market trends by analyzing high and low price movements to detect potential reversals and continuations.
A Break of Structure (BOS) indicator using moving averages to identify early trend changes and potential trading opportunities, focusing on detecting swing highs and lows.
A predictive indicator that calculates the probability of moving average crossovers by analyzing potential future price movements and predicting MA interactions before they occur.
Likes, views, and comments are historical TradingView snapshots. They describe attention, not trading performance.