YOUR INDICATOR RESEARCH STARTS HERE

Find the right indicator.
Understand what it does.

Explore 11,183 indicators. Filter beyond the obvious.
Discover the tools that fit the way you trade.

THE INDICATOR LIBRARY

Results for “Least Squares Moving Average (LSMA)”

11,183 tools to explore

14 indicators matching your filters
Save search
TrendMomentumEditor’s pick

Polynomial Regression Bands + Channel [DW]

by DonovanWall

A polynomial regression indicator that calculates complex curve-fitting relationships between price variables, enabling advanced trend analysis and least squares moving average (LSMA) generation.

Main price chart · unverifiedDay Trading · Swing Trading
Explore
2Klikes61.6Kviews42comments
Save
OscillatorSignalTrend

LSMA Z-Score [BackQuant]

by BackQuant

A statistical indicator that transforms Least Squares Moving Average into a Z-Score, providing normalized trend analysis with adaptable color-coding to highlight market dynamics and potential reversals.

Separate pane · unverifiedScalping · Day Trading
Explore
754likes11.3Kviews8comments
Save
SignalTrendVolatility

Lsma ATR | viResearch

by bii_vg

A dynamic trend and volatility indicator that combines Least Squares Moving Average with Average True Range to detect trend direction and market volatility with adaptive boundaries.

Main price chart · unverifiedScalping · Day Trading
Explore
541likes5.6Kviews2comments
Save
SignalTrend

Lsma | viResearch

by bii_vg

The Lsma indicator uses linear regression to analyze price trends, providing a more responsive and precise method for detecting market direction with customizable settings.

Main price chart · unverifiedScalping · Day Trading
Explore
507likes4.3Kviews2comments
Save
SignalTrend

TOMMAR

by Tommy_Trader

Multi-Moving Averages Ribbon (MMAR) indicator using 12 different moving average types to analyze price trends and provide trading signals across multiple timeframes.

Main price chart · unverifiedScalping · Day Trading
Explore
360likes6.3Kviews6comments
Save
TrendSignal

SLSMA - Smooth LSMA

by veryfid

SLSMA is an advanced moving average technique that smooths price regression lines, providing more stable trend analysis and stronger pivotal points in market movements.

Main price chart · unverifiedScalping · Day Trading
Explore
304likes6.2Kviews4comments
Save
SignalTrendVolatility

Chandelier Exit with ZLSMA SwiftEdge

by SwiftEdge

A sophisticated trading indicator combining Chandelier Exit and Zero Lag LSMA to generate trend reversal signals with intelligent strength scoring and visual trend confirmation.

Main price chart · unverifiedScalping · Day Trading
Explore
127likes2.8Kviews0comments
Save
TrendVolatility

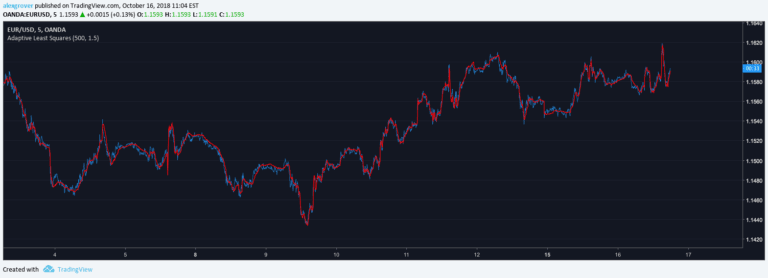
Adaptive Least Squares

by alexgrover

An adaptive filtering technique that dynamically adjusts its parameters based on market volatility, creating a responsive trend indicator that adapts to changing price movements.

Main price chart · unverifiedDay Trading · Swing Trading
Explore
98likes4Kviews4comments
Save
MomentumOscillator

Banana RSI

by SamRecio

Banana RSI is a unique RSI variant using cumulative high and low averages with linear regression smoothing to dynamically identify overbought and oversold levels.

Separate pane · unverifiedScalping · Day Trading
Explore
88likes2.9Kviews1comments
Save

Likes, views, and comments are historical TradingView snapshots. They describe attention, not trading performance.

START WITH A QUESTION

A little less searching.
A lot more understanding.

Tell DeepAlpha what you need. Get an explanation, a shortlist,
and a direct path to the indicators behind it.

Ask DeepAlpha