YOUR INDICATOR RESEARCH STARTS HERE

Find the right indicator.
Understand what it does.

Explore 11,183 indicators. Filter beyond the obvious.
Discover the tools that fit the way you trade.

THE INDICATOR LIBRARY

Results for “MES”

11,183 tools to explore

221 indicators matching your filters
Save search
VolumeEditor’s pick

Volume Profile / Fixed Range

by LonesomeTheBlue

A Volume Profile indicator that calculates trading volumes within a fixed range, helping traders understand volume distribution and identifying key price levels with visual representation.

Main price chart · unverifiedDay Trading · Swing Trading
Explore
13.4Klikes576.6Kviews171comments

Save
TrendVolatilityEditor’s pick

Support Resistance MTF

by LonesomeTheBlue

A multi-timeframe support and resistance indicator that helps traders identify key price levels by analyzing market data across different time frames and customizable settings.

Main price chart · unverifiedDay Trading · Swing Trading
Explore
8.9Klikes368.4Kviews103comments
Save
VolumeEditor’s pick

Heatmap Volume [xdecow]

by xdecow

A volume heat map indicator that colors volume bars and candles based on the standard deviation of trading volume from its average. Provides visual insights into volume intensity and potential market significance.

Separate pane · unverifiedDay Trading · Swing Trading
Explore
7.2Klikes214.2Kviews107comments
Save
VolumeTrendEditor’s pick

Intraday Volume Swings

by rumpypumpydumpy

A trading signal that tracks volume swings by identifying increasing volume and higher highs/lower lows across multiple bars, revealing potential support and resistance levels.

Main price chart · unverifiedDay Trading
Explore
5.4Klikes156.4Kviews16comments
Save
TrendMomentumEditor’s pick

Ichimoku Kinkō hyō 目均衡表

by RickSimpson

An advanced Ichimoku Kinko Hyo indicator with extensive customization options for analyzing market trends, momentum, and potential trading signals across different timeframes.

Main price chart · unverifiedDay Trading · Swing Trading
Explore
5.2Klikes144.4Kviews125comments
Save
VolumeEditor’s pick

Volume Footprint Voids [BigBeluga]

by BigBeluga

Volume Footprint Voids is a trading indicator that uses lower timeframe calculations to plot single candle Point of Control (POC) and identify volume imbalances for precise entry and exit points.

Main price chart · unverifiedScalping · Day Trading
Explore
4.3Klikes135.4Kviews37comments
Save
VolumeEditor’s pick

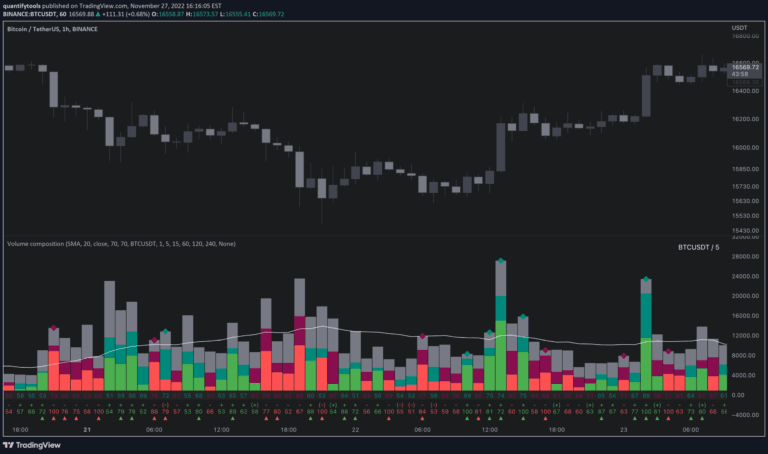
Volume composition / quantifytools

by quantifytools

Volume composition indicator that breaks down trading volume into buy, sell, passive, and active components to provide deeper insights into market liquidity and potential price movements.

Separate pane · unverifiedDay Trading · Swing Trading
Explore
4Klikes160.1Kviews100comments
Save
VolumeTrendSignal

Volume Order Blocks [BigBeluga]

by BigBeluga

Volume Order Blocks is a powerful trading indicator that identifies significant order blocks using EMA crossovers, volume analysis, and price structure to highlight key supply and demand zones.

Main price chart · unverifiedScalping · Day Trading
Explore
3.8Klikes63.8Kviews17comments
Save
LevelsTrendVolume

Volume Profile Plus

by AlphaViz

Advanced volume profile indicator offering high-resolution analysis of trading volume across multiple range modes, providing traders with detailed insights into market structure and price-volume relationships.

Main price chart · unverifiedScalping · Day Trading
Explore
3.7Klikes57.9Kviews36comments
Save

Likes, views, and comments are historical TradingView snapshots. They describe attention, not trading performance.

START WITH A QUESTION

A little less searching.
A lot more understanding.

Tell DeepAlpha what you need. Get an explanation, a shortlist,
and a direct path to the indicators behind it.

Ask DeepAlpha