
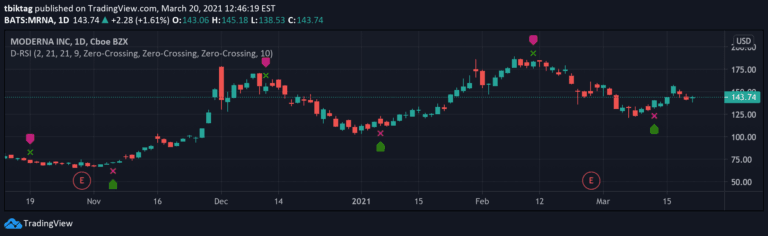
Delta-RSI Oscillator Strategy
Delta-RSI Oscillator is a momentum indicator that measures the rate of change in RSI through a smoothed time derivative, providing dynamic insights into market momentum shifts.
Explore 11,183 indicators. Filter beyond the obvious.
Discover the tools that fit the way you trade.
11,183 tools to explore
Delta-RSI Oscillator is a momentum indicator that measures the rate of change in RSI through a smoothed time derivative, providing dynamic insights into market momentum shifts.
A momentum indicator that uses Hull Moving Average to track price shifts, creating dynamic five-level zones that highlight momentum strength and potential trend changes.
FRAMA Channel is a dynamic trend-following indicator that adapts to market conditions, creating an adaptive channel around price to identify trend changes and market momentum.
Range Tightening Indicator tracks price volatility, identifying low-volatility consolidation periods that potentially signal upcoming market breakouts and momentum shifts.
A unique Stochastic RSI indicator visualized using Heikin-Ashi candles, providing a clearer representation of momentum and trend direction through gradient color-coded candles.
Advanced RSI indicator with gradient-filled zones, divergence detection, and customizable settings to help traders identify market trends, potential reversals, and trading opportunities.
A technical analysis tool using three moving averages and MACD to identify asset trends and momentum, helping traders understand price movement and potential trading signals.
A 3-moving average crossover strategy that generates trading signals by tracking the relationship between fast, medium, and slow moving averages to identify trend direction and potential trade opportunities.
MOM-LRC [AB] is a technical analysis indicator that calculates exponential RSI and momentum channel using linear regression to identify potential price movements and trading opportunities.
A comprehensive multi-timeframe trading signal generator that combines multiple technical analysis methods to provide precise buy and sell signals with dynamic risk management and trend confirmation.
The Velocity Indicator captures stock movement speed using a unique calculation. It provides momentum insights through color-coded signals and zero-line crossovers for trading decisions.
TriTrend Nexus is a comprehensive market analysis tool that combines three signals into a single interface, providing traders with a holistic view of market conditions and potential trend shifts.
Likes, views, and comments are historical TradingView snapshots. They describe attention, not trading performance.