YOUR INDICATOR RESEARCH STARTS HERE

Find the right indicator.
Understand what it does.

Explore 11,183 indicators. Filter beyond the obvious.
Discover the tools that fit the way you trade.

THE INDICATOR LIBRARY

Results for “OTT”

11,183 tools to explore

119 indicators matching your filters
Save search
TrendMomentum

Ichimoku

by HPotter

Ichimoku Kinko Hyo is a comprehensive technical indicator that provides insights into trend direction, momentum, and potential support and resistance levels using multiple components.

Main price chart · unverifiedDay Trading · Swing Trading
Explore
17.2Klikes261.7Kviews48comments

Save
TrendEditor’s pick

Optimized Trend Tracker

by KivancOzbilgic

Optimized Trend Tracker (OTT) is an advanced indicator designed to identify market trend direction and provide clear buy and sell signals based on price movements relative to the indicator line.

Main price chart · unverifiedDay Trading · Swing Trading
Explore
16.6Klikes445.2Kviews147comments
Save
TrendMomentumEditor’s pick

Elliott Wave [LuxAlgo]

by LuxAlgo

Elliott Wave indicator automatically detects impulse and corrective wave patterns in price movements, helping traders identify potential trend directions and market phases.

Main price chart · unverifiedDay Trading · Swing Trading
Explore
11.4Klikes476Kviews157comments
Save
LevelsSignal

High/Low Location Frequency [LuxAlgo]

by LuxAlgo

A market analysis tool that calculates probabilities of price tops and bottoms across various time periods, offering traders strategic insights into market timing and potential trend reversals.

Separate pane · unverifiedScalping · Day Trading
Explore
2.5Klikes48.1Kviews7comments
Save
ChannelsTrendVolatility

Progressive Trend Tracker

by KivancOzbilgic

Progressive Trend Tracker is a dynamic Bollinger Bands variant using Highest Highs and Lowest Lows to generate precise trading signals with VIDYA moving average.

Main price chart · unverifiedScalping · Day Trading
Explore
2.3Klikes40.7Kviews22comments
Save
SignalPatterns

Double Top/Bottom [AlgoAlpha]

by AlgoAlpha

A precise indicator that identifies double top and bottom reversal patterns in market price action, helping traders recognize potential trend changes with customizable settings and visual enhancements.

Main price chart · unverifiedScalping · Day Trading
Explore
2.1Klikes30.4Kviews5comments
Save
VolumeTrendEditor’s pick

#NAME?

by ClassicScott

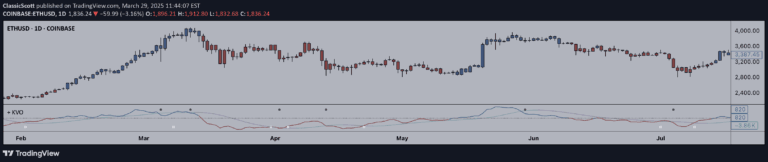
The Klinger Oscillator is a volume-based technical indicator that compares price changes and volume to determine potential trend reversals and market momentum.

Separate pane · unverifiedDay Trading · Swing Trading
Explore
1.9Klikes62.3Kviews40comments
Save
LevelsMomentumSignal

Top G indicator [BigBeluga]

by BigBeluga

Top G Indicator helps traders identify market extremes by spotting high-probability tops and bottoms using dynamic range analysis and momentum shifts.

Main price chart · unverifiedScalping · Day Trading
Explore
1.9Klikes36.2Kviews30comments
Save

Likes, views, and comments are historical TradingView snapshots. They describe attention, not trading performance.

START WITH A QUESTION

A little less searching.
A lot more understanding.

Tell DeepAlpha what you need. Get an explanation, a shortlist,
and a direct path to the indicators behind it.

Ask DeepAlpha