
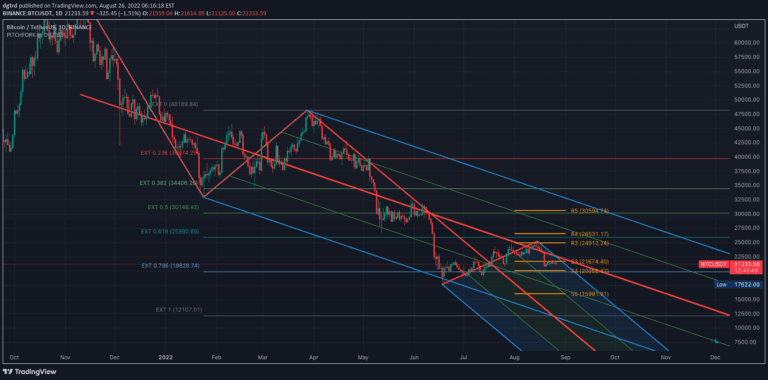
Auto Pitchfork, Fib Retracement and Zig Zag by DGT
Pitchfork is a technical indicator that helps traders identify potential support and resistance levels by drawing trend lines based on three strategic points in price movement.
Explore 11,183 indicators. Filter beyond the obvious.
Discover the tools that fit the way you trade.
11,183 tools to explore
Pitchfork is a technical indicator that helps traders identify potential support and resistance levels by drawing trend lines based on three strategic points in price movement.
A dynamic support and resistance indicator that tracks buy and sell power within price zones, helping traders identify potential market reversals and breakout opportunities.
A trend channel indicator that identifies support and resistance zones using pivot highs and lows, helping traders visualize market trends and potential breakout points.
Periodic Linear Regressions (PLR) calculates linear trend lines over customizable periods, helping traders identify underlying price trends and potential support/resistance zones.
NR4 & NR7 is a pattern recognition indicator that identifies narrow range candles to detect potential market breakouts and low volatility transitions.
The FVG Channel indicator tracks unmitigated fair value gaps to create dynamic trend channels that help identify market trends, potential reversals, and significant price levels.
A dynamic trend indicator that fits regression lines at different intervals, revealing market trends and potential price channels by calculating linear trends across specified timeframes.
A dynamic volatility indicator using standard deviation bands to analyze price movements, trend direction, and potential reversals with customizable settings.
Price channels are technical analysis tools that use parallel trendlines to define dynamic support and resistance zones, helping traders identify trend direction and potential entry/exit points.
A Half Cup indicator that detects potential trading opportunities by identifying partial cup patterns and tracking channel breakouts with visual dot markers.
Rolling VWAP Channel creates a dynamic indicator using multiple Volume Weighted Average Prices to analyze price clusters and potential market directional changes through percentile interpolation.
The Nadaraya-Watson Envelope Indicator provides dynamic market insights by analyzing price movements using logarithmic scales and ATR-based envelope boundaries for precise trend identification.
Likes, views, and comments are historical TradingView snapshots. They describe attention, not trading performance.