EMA 9/21 with Target Price [SS]
An EMA 9/21 crossover indicator that uses Average True Range (ATR) to calculate potential price targets based on EMA crossovers and market sentiment.
Explore 11,183 indicators. Filter beyond the obvious.
Discover the tools that fit the way you trade.
11,183 tools to explore
An EMA 9/21 crossover indicator that uses Average True Range (ATR) to calculate potential price targets based on EMA crossovers and market sentiment.
A comprehensive candlestick pattern screener that monitors up to 40 symbols, identifying and tracking various candlestick formations to help traders understand market psychology and price action.
A chart background color indicator that helps traders identify market trend direction by analyzing price, moving averages, and market breadth on daily charts.
A multi-symbol divergence screener that monitors up to 24 trading symbols simultaneously, identifying potential trading signals across different indicators and timeframes.
A real-time price converter tool that maps corresponding price levels across multiple linked market instruments like QQQ, NDX, and NQ for enhanced trading insights.
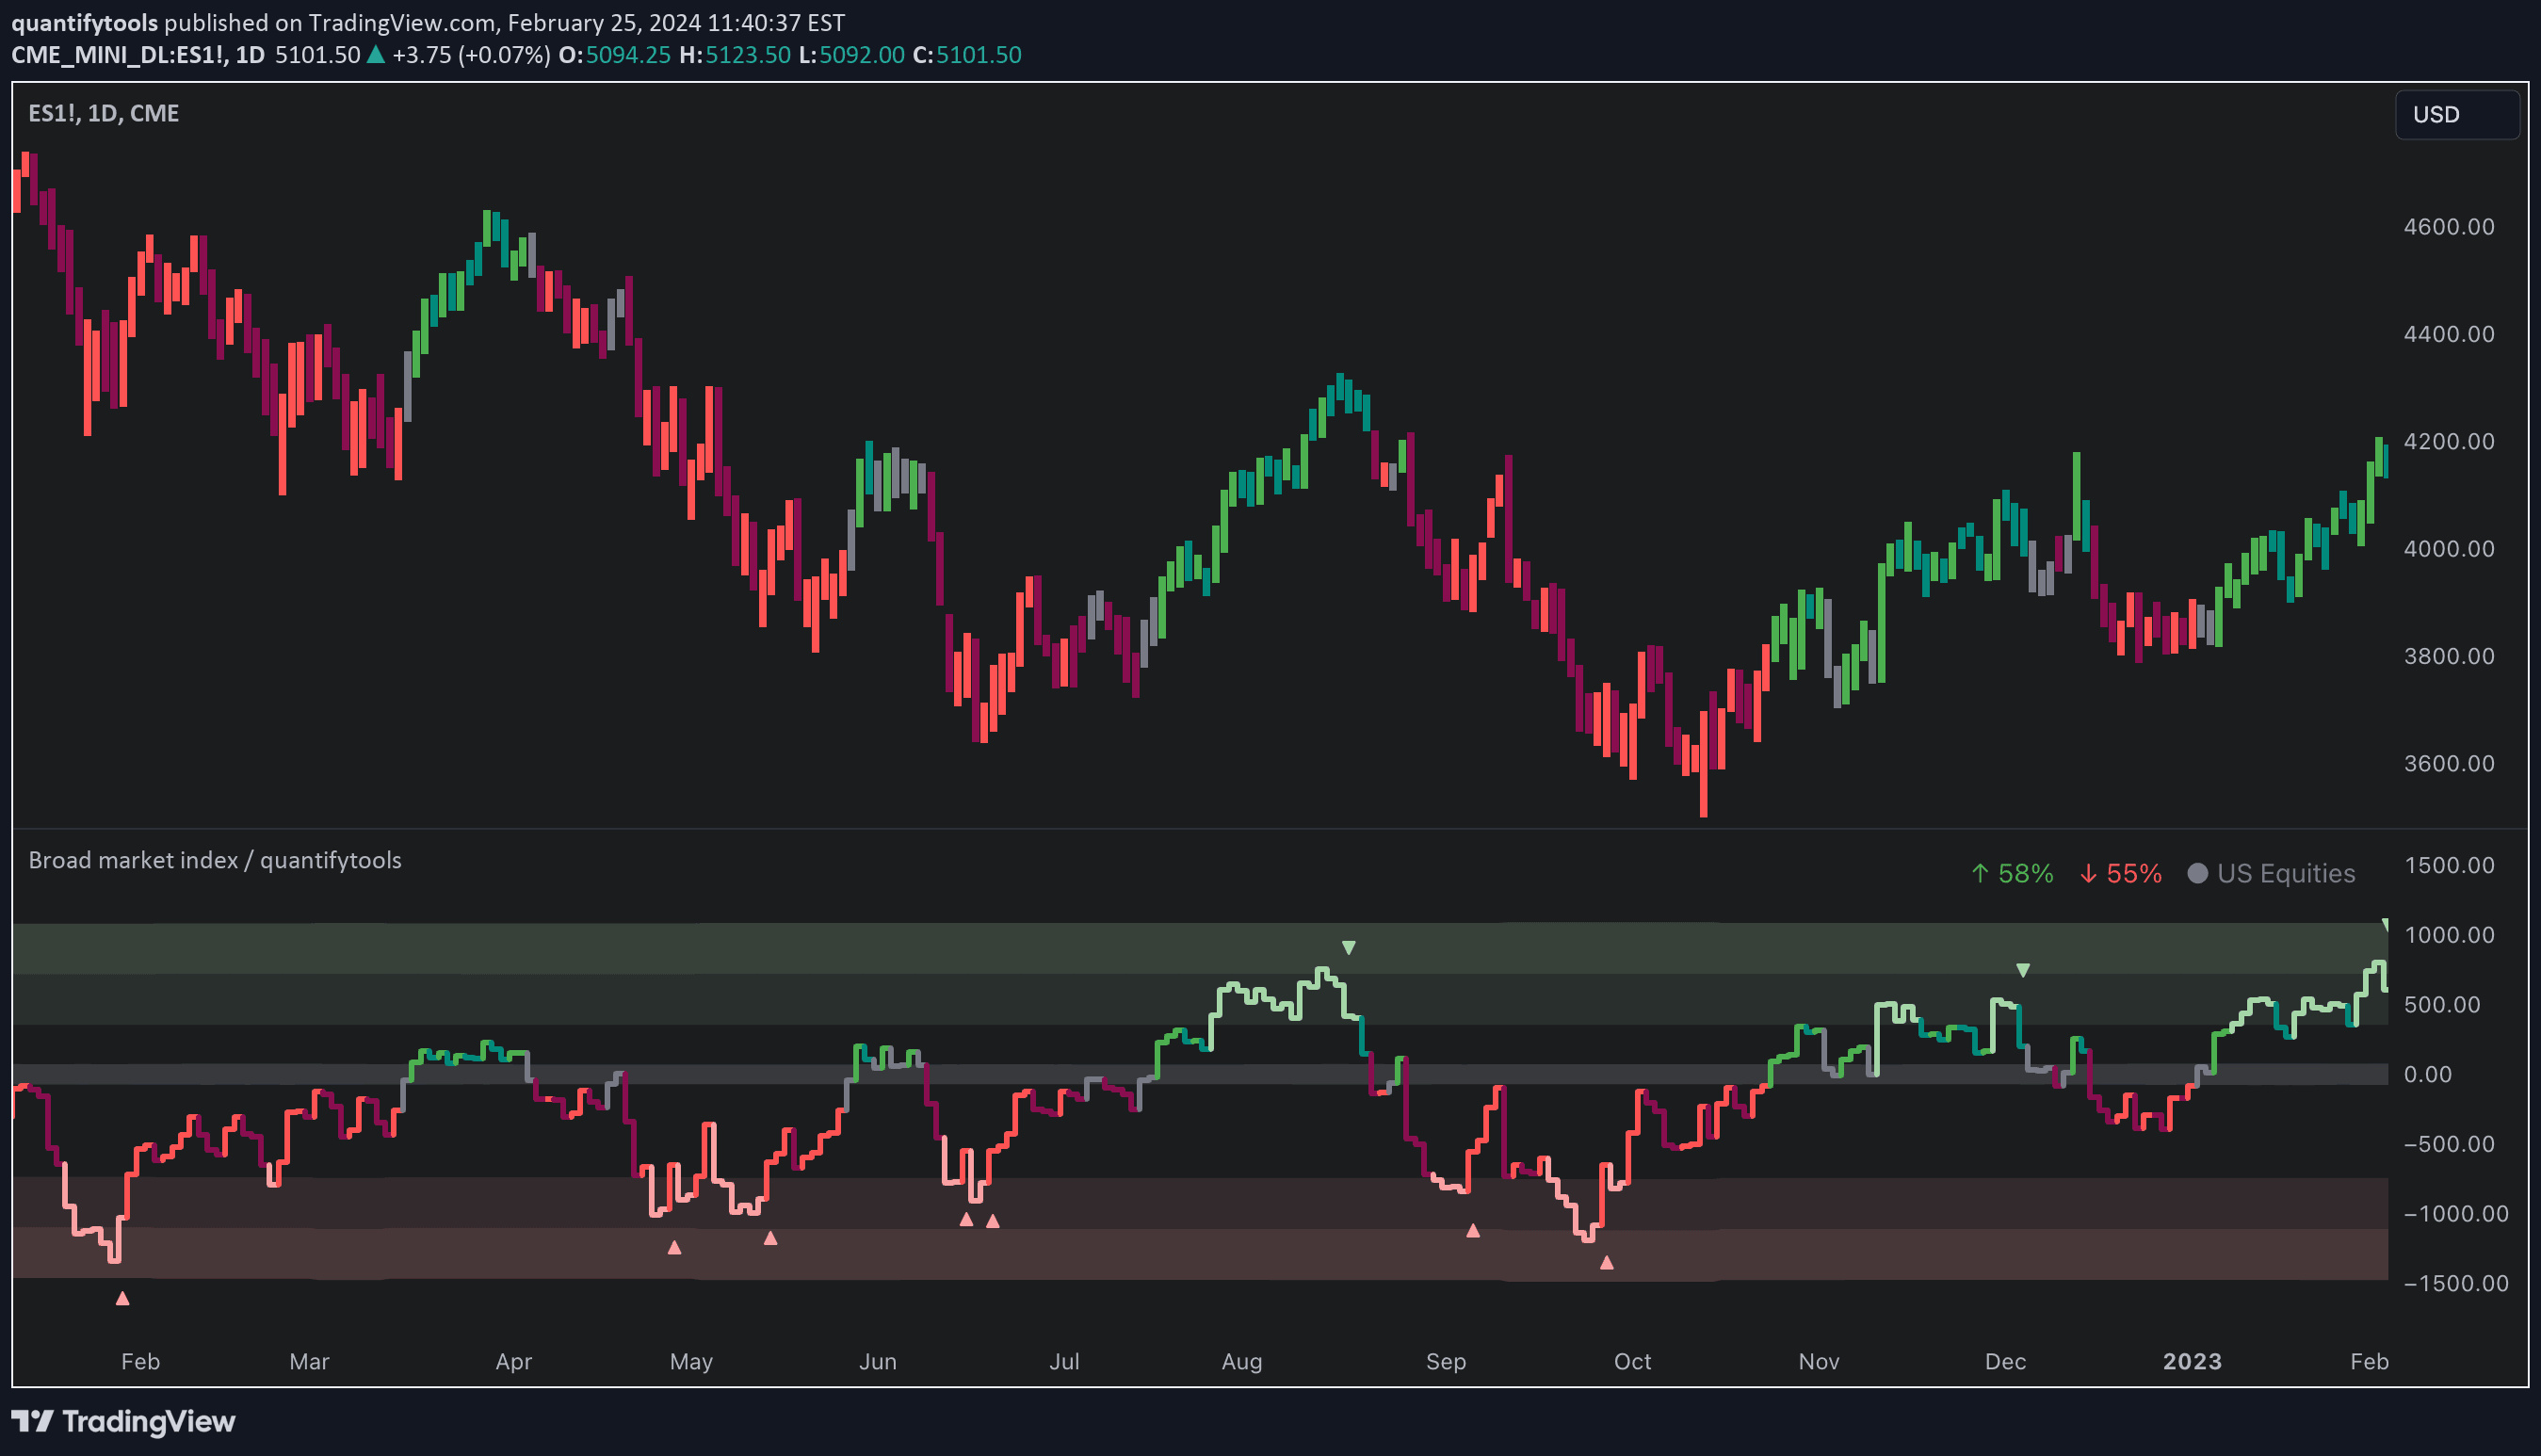
Market breadth indicator analyzing the ratio of advancing versus declining symbols to determine overall market trend and potential reversals in broad market movements.
A trading strategy identifying reversal zones beyond the opening range, using fibonacci levels and entry time restrictions to generate potential trading opportunities in options.
A correlation-based indicator tracking Put to Call ratio against stock price, revealing market sentiment and potential reversals through statistical analysis of options trading activity.
A market breadth indicator measuring the percentage of U.S. stocks above or below their VWAP, providing insights into overall market momentum and potential trading directions.
A trading indicator that identifies key price levels for QQQ and SPY assets, helping traders spot potential support and resistance zones across related market instruments.
An advanced Fair Value Gap indicator that identifies regular and inverse market gaps across multiple timeframes, providing precise support/resistance zones and potential trading signals.
Supertrend Heikin Ashi combines Supertrend calculation with Heikin Ashi candles to generate more filtered trading signals by reducing false movements.
Likes, views, and comments are historical TradingView snapshots. They describe attention, not trading performance.