RSI cyclic smoothed v2
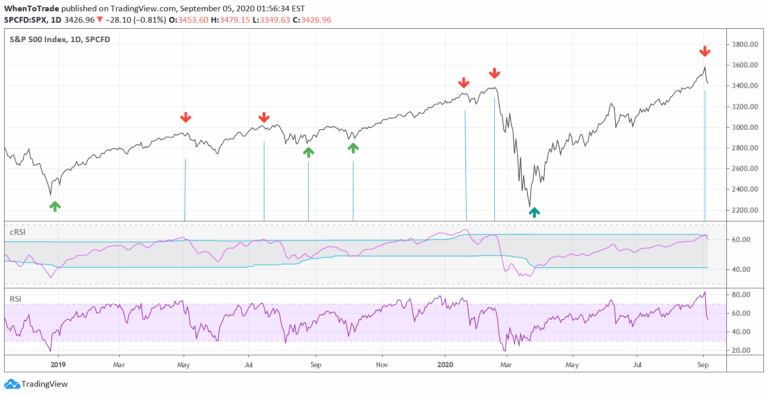
An enhanced RSI indicator that uses cyclic smoothing and adaptive bands to provide more responsive market trend signals by incorporating dominant cycle length.
Explore 11,183 indicators. Filter beyond the obvious.
Discover the tools that fit the way you trade.
11,183 tools to explore
An enhanced RSI indicator that uses cyclic smoothing and adaptive bands to provide more responsive market trend signals by incorporating dominant cycle length.
A custom ZigZag indicator that identifies market reversals using momentum indicators, providing true pivot points without repainting and highlighting impulse strength.
Laguerre RSI is a noise-reduced momentum indicator using John EHLERS' Laguerre Filter to analyze market trends by tracking price movement smoothness and potential reversals.
HARSI is a unique oscillator combining Heikin Ashi candles with RSI calculations, designed to reduce noise and provide smoother trend analysis for traders.
The Ultimate RSI is an advanced oscillator that enhances traditional RSI by emphasizing trend dynamics, providing more precise insights into market momentum and directional movements.
The RMI Trend Sniper is a sophisticated trend-following indicator that combines RSI and MFI to generate momentum signals and identify potential market trend reversals.
AlphaTrend is a dynamic trend-following indicator that uses Money Flow Index or RSI to generate buy and sell signals based on trend direction and momentum crossovers.
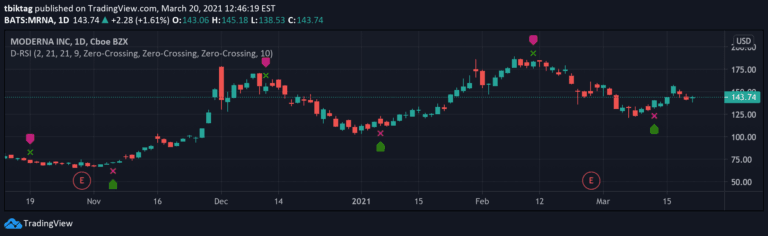
Delta-RSI Oscillator is a momentum indicator that measures the rate of change in RSI through a smoothed time derivative, providing dynamic insights into market momentum shifts.
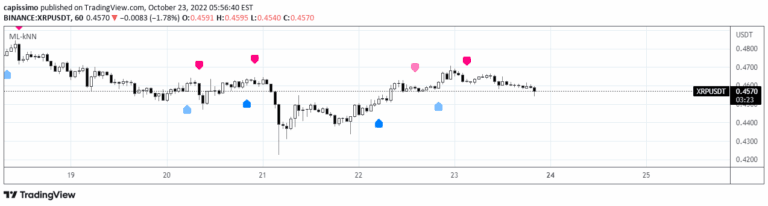
A k-Nearest Neighbours machine learning strategy that predicts market moves by analyzing historic data and finding similar past market conditions to forecast future price directions.
A specialized RSI indicator using Kernel Density Estimation to predict potential pivot points by analyzing historical RSI patterns and calculating probability of price reversals.
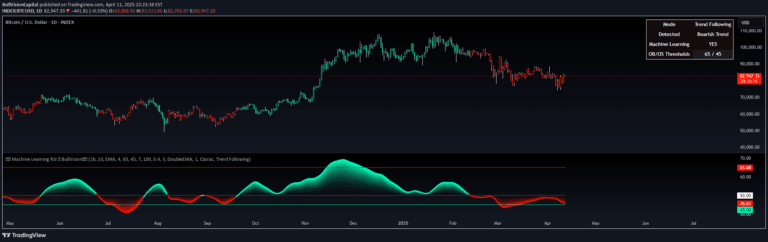
A sophisticated RSI indicator that uses machine learning and K-Nearest Neighbors to dynamically adapt momentum analysis by comparing current market conditions with historical patterns.
An experimental trading signal applying the Logistic Map Equation to popular indicators like Awesome Oscillator, ROC, RSI, and Stochastic to generate unique market insights through iterative mathematical calculations.
Likes, views, and comments are historical TradingView snapshots. They describe attention, not trading performance.