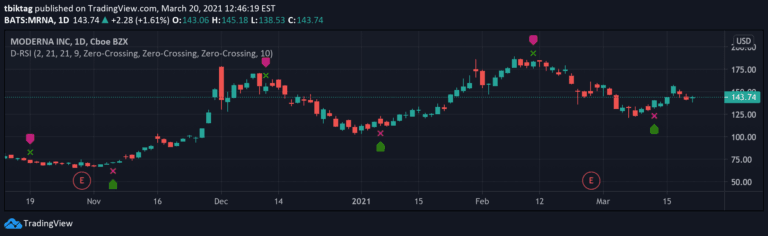
Delta-RSI Oscillator Strategy
Delta-RSI Oscillator is a momentum indicator that measures the rate of change in RSI through a smoothed time derivative, providing dynamic insights into market momentum shifts.
Explore 11,183 indicators. Filter beyond the obvious.
Discover the tools that fit the way you trade.
11,183 tools to explore
Delta-RSI Oscillator is a momentum indicator that measures the rate of change in RSI through a smoothed time derivative, providing dynamic insights into market momentum shifts.
A trading tool highlighting specific time-based market zones and Fibonacci retracements to identify optimal entry points across different forex trading sessions.
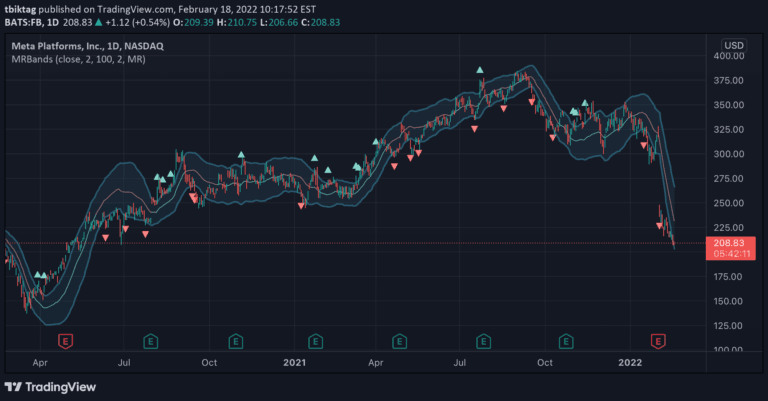
Moving Regression Prediction Bands combine regression analysis and statistical prediction to create a dynamic price prediction channel with upper and lower bands indicating potential price momentum and trend shifts.
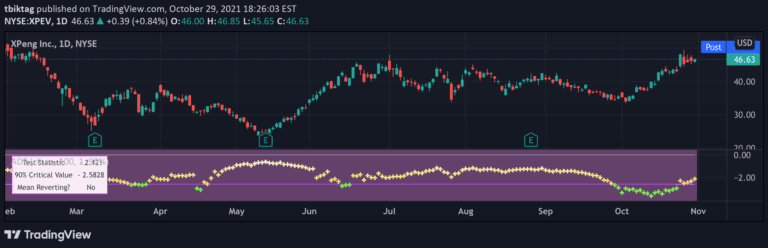
The Augmented Dickey-Fuller test statistically evaluates mean reversion in price series by analyzing the tendency of prices to return to an average level over time.
A trading signal combining Supertrend and Donchian channels to identify potential market reversals, designed for trend analysis across different timeframes with customizable sensitivity.
A composite EMA indicator that compares an asset's closing price with the XU100 index, scaling EMA values to provide unique market trend and support/resistance insights.
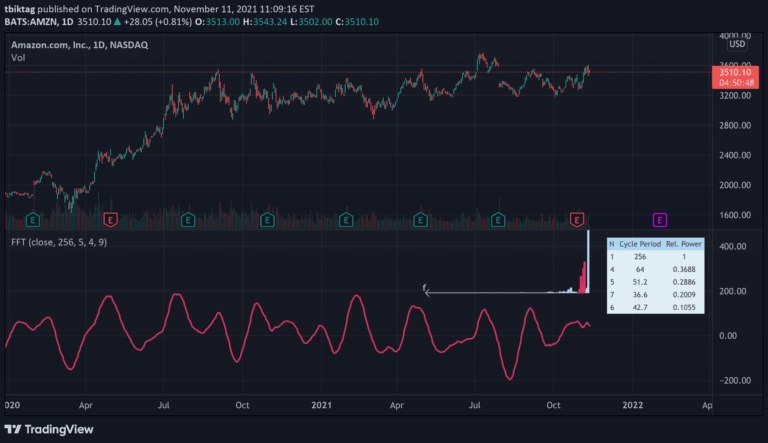
A Fast Fourier Transform (FFT) algorithm that decomposes time series data into cyclical frequency components, enabling advanced time series filtering and analysis.
A trading tool that plots global market sessions with volume and delta analytics, helping traders visualize institutional activity and key market structure zones.
ICT Daily Levels and Zones indicator automatically highlights key trading levels and zones for ICT-style traders, providing essential market context and timing insights.
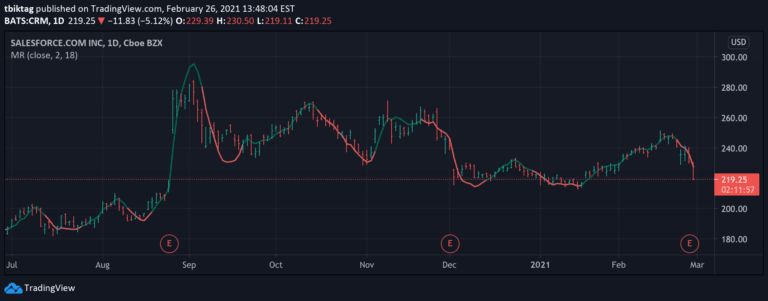
Moving Regression is a flexible trend analysis method that approximates data points using polynomial functions to smooth noise, assess momentum, and predict trend direction.
A trading indicator identifying market maker liquidity targets through multi-timeframe highs/lows and fair value gaps, helping traders predict potential price movements.
A multi-functional candlestick overlay that provides various visualization options and buy/sell signals using different technical indicators to help traders identify market trends and potential entry/exit points.
Likes, views, and comments are historical TradingView snapshots. They describe attention, not trading performance.