YOUR INDICATOR RESEARCH STARTS HERE

Find the right indicator.
Understand what it does.

Explore 11,183 indicators. Filter beyond the obvious.
Discover the tools that fit the way you trade.

THE INDICATOR LIBRARY

Results for “TMA”

11,183 tools to explore

149 indicators matching your filters
Save search
TrendVolatilityEditor’s pick

PMax Explorer STRATEGY & SCREENER

by KivancOzbilgic

PMax Explorer is a trading strategy that combines moving stop loss and SuperTrend indicators to generate reliable buy and sell signals for trend identification and potential reversals.

Main price chart · unverifiedDay Trading · Swing Trading
Explore
15.1Klikes238.4Kviews114comments
Save
VolumeEditor’s pick

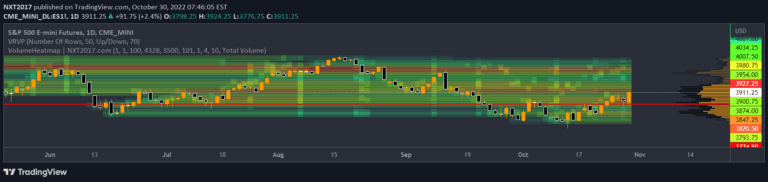
Heatmap Volume [xdecow]

by xdecow

A volume heat map indicator that colors volume bars and candles based on the standard deviation of trading volume from its average. Provides visual insights into volume intensity and potential market significance.

Separate pane · unverifiedDay Trading · Swing Trading
Explore
7.2Klikes214.2Kviews107comments
Save
LevelsPatternsSignal

ICT Immediate Rebalance Toolkit [LuxAlgo]

by LuxAlgo

A comprehensive trading toolkit that identifies critical market zones, institutional liquidity levels, and potential price movement patterns using advanced technical analysis techniques.

Main price chart · unverifiedScalping · Day Trading
Explore
5.7Klikes106.8Kviews13comments
Save
LevelsTrendVolume

Range Analysis - By Leviathan

by LeviathanCapital

An advanced trading tool that analyzes price ranges by automatically drawing range levels, volume profiles, and various analytical tools to help traders understand market structure and potential price movements.

Main price chart · unverifiedScalping · Day Trading
Explore
4.7Klikes89.1Kviews41comments
Save
VolumeEditor’s pick

Liquidity Heatmap LTF [LuxAlgo]

by LuxAlgo

A trading tool that visualizes candle bodies with the highest volume on a lower timeframe, highlighting areas of significant market activity using color-coded heatmaps and interval lines.

Main price chart · unverifiedDay Trading
Explore
3.9Klikes261.6Kviews30comments
Save
LevelsSignalVolume

Open Liquidity Heatmap [BigBeluga]

by BigBeluga

An advanced liquidity heatmap that accumulates and tracks resting liquidity levels over time, revealing potential high-impact price zones by aggregating volume across multiple price levels.

Main price chart · unverifiedScalping · Day Trading
Explore
3.9Klikes79.1Kviews28comments
Save
VolumeSignalLevels

Liquidity Heatmap [BigBeluga]

by BigBeluga

A trading indicator that identifies potential liquidity zones by analyzing volume or open interest to reveal possible liquidation levels and market activity zones.

Main price chart · unverifiedScalping · Day Trading
Explore
2.8Klikes97.4Kviews34comments
Save

Likes, views, and comments are historical TradingView snapshots. They describe attention, not trading performance.

START WITH A QUESTION

A little less searching.
A lot more understanding.

Tell DeepAlpha what you need. Get an explanation, a shortlist,
and a direct path to the indicators behind it.

Ask DeepAlpha