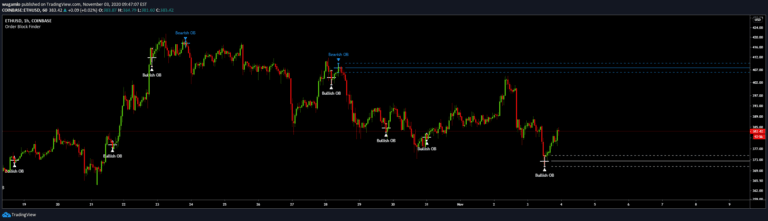
Market Structure Break & Order Block by EmreKb
A market structure break and order block indicator that identifies trend reversals by analyzing price action breakouts and key candle formations to signal potential trading opportunities.
Explore 11,183 indicators. Filter beyond the obvious.
Discover the tools that fit the way you trade.
11,183 tools to explore
A market structure break and order block indicator that identifies trend reversals by analyzing price action breakouts and key candle formations to signal potential trading opportunities.
Advanced trading tool that detects divergences across multiple technical indicators, helping traders identify potential trend reversals and momentum shifts through comprehensive pivot point analysis.
A customizable trading indicator designed to identify ICT Killzones and track high and low price pivots during specific market sessions with configurable time windows.
An indicator identifying institutional order blocks by detecting significant price zones where potential trend reversals or continuations might occur based on sequential candle patterns.
Pivot Point SuperTrend is an advanced trend-following indicator that combines pivot points with SuperTrend to generate more reliable trading signals and identify potential trend reversals.
A machine learning-powered SuperTrend indicator that uses k-means clustering to dynamically adapt to market volatility, providing intelligent trend identification and volatility insights.
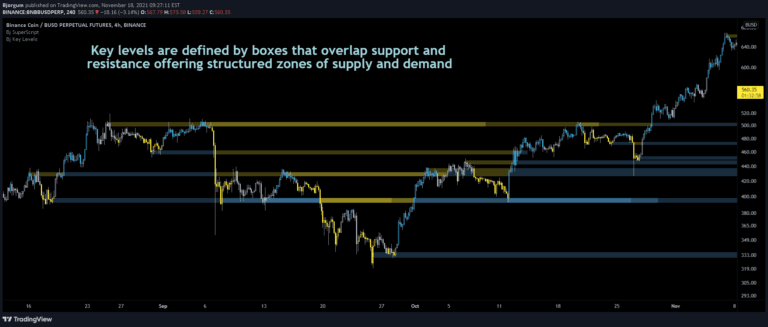
Key Levels strategy identifies critical price action points like breakouts, false breakouts, and backchecks to help traders understand market movement and potential trading opportunities.
SuperTrend AI is an advanced machine learning technique that applies K-means clustering to the SuperTrend indicator, dynamically adapting trailing stop settings based on performance metrics.
Breakout Probability indicator calculates the likelihood of new market highs or lows by analyzing historical price action and displaying percentage probabilities for potential price levels.
Optimized Trend Tracker (OTT) is an advanced indicator designed to identify market trend direction and provide clear buy and sell signals based on price movements relative to the indicator line.
A multi-indicator divergence script that analyzes divergences across 10 different technical indicators to identify potential trend reversals and price movements.
Hull Moving Average (HMA) is an advanced technical indicator designed to minimize lag and provide smooth trend visualization across multiple variants with customizable settings.
Likes, views, and comments are historical TradingView snapshots. They describe attention, not trading performance.