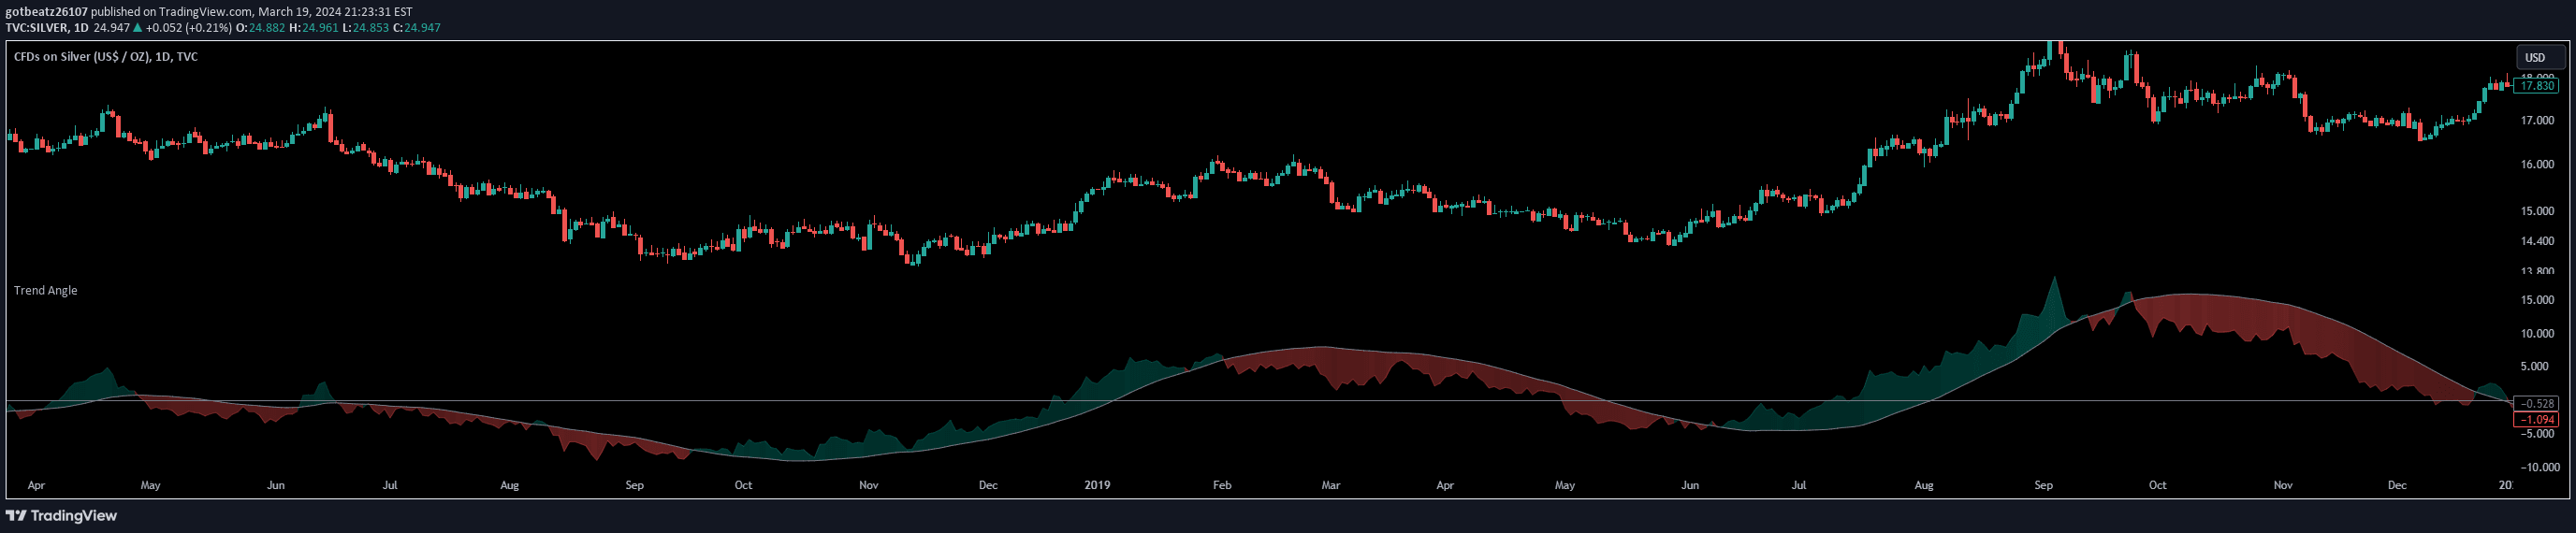
Trend Angle
Trend Angle calculates the inclination of price movements over a specified timeframe, providing traders with a quantitative method to assess market directionality and momentum.
Explore 11,183 indicators. Filter beyond the obvious.
Discover the tools that fit the way you trade.
11,183 tools to explore
Trend Angle calculates the inclination of price movements over a specified timeframe, providing traders with a quantitative method to assess market directionality and momentum.
TrigWave Suite combines multiple advanced moving averages and analysis techniques to generate comprehensive trading signals using hyperbolic, sine, and cosine-weighted calculations.
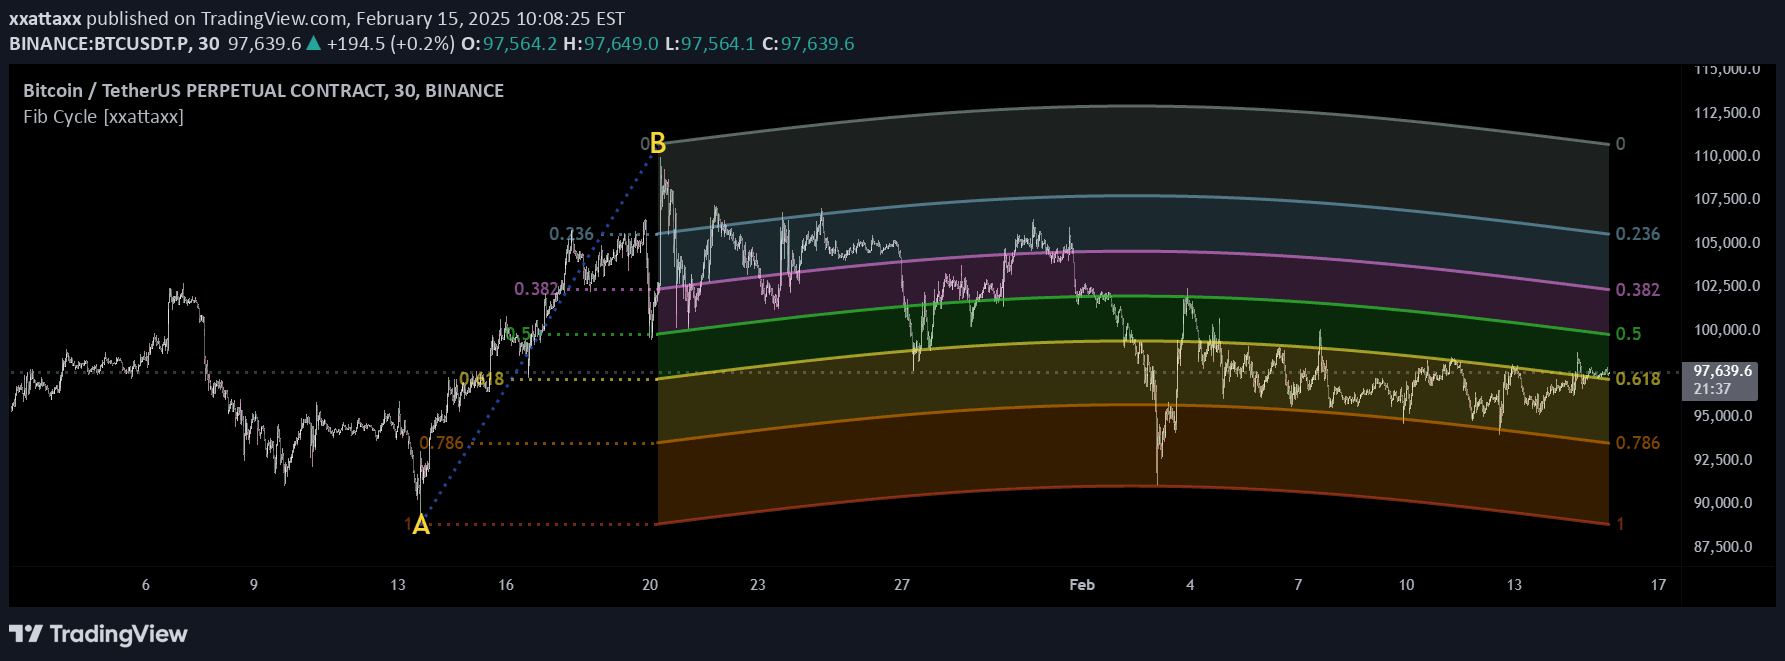
A dynamic Fibonacci analysis tool that transforms traditional retracement levels into wave-based cycles, offering a non-linear approach to understanding market structure and price movements.
A MACD-based trading indicator that provides customizable bullish and bearish signals using triangular markers and multiple trigger conditions for precise entry and exit points.
A cross-exchange charting tool that compares Binance spot and Bybit perpetual charts to analyze price movements, correlations, and market trends across different timeframes.
A trigonometric-based indicator that uses Taylor Series approximations to analyze price movements, providing a smoothed mathematical component with dynamic scaling.
A trigger program designed to identify volume triggers on watched stocks, helping traders assess potential entry points by analyzing trading volume on individual candles.
A dynamic geometric visualization tool that transforms mathematical constants and Fibonacci sequences into evolving chart patterns, offering unique insights into market movements and mathematical relationships.
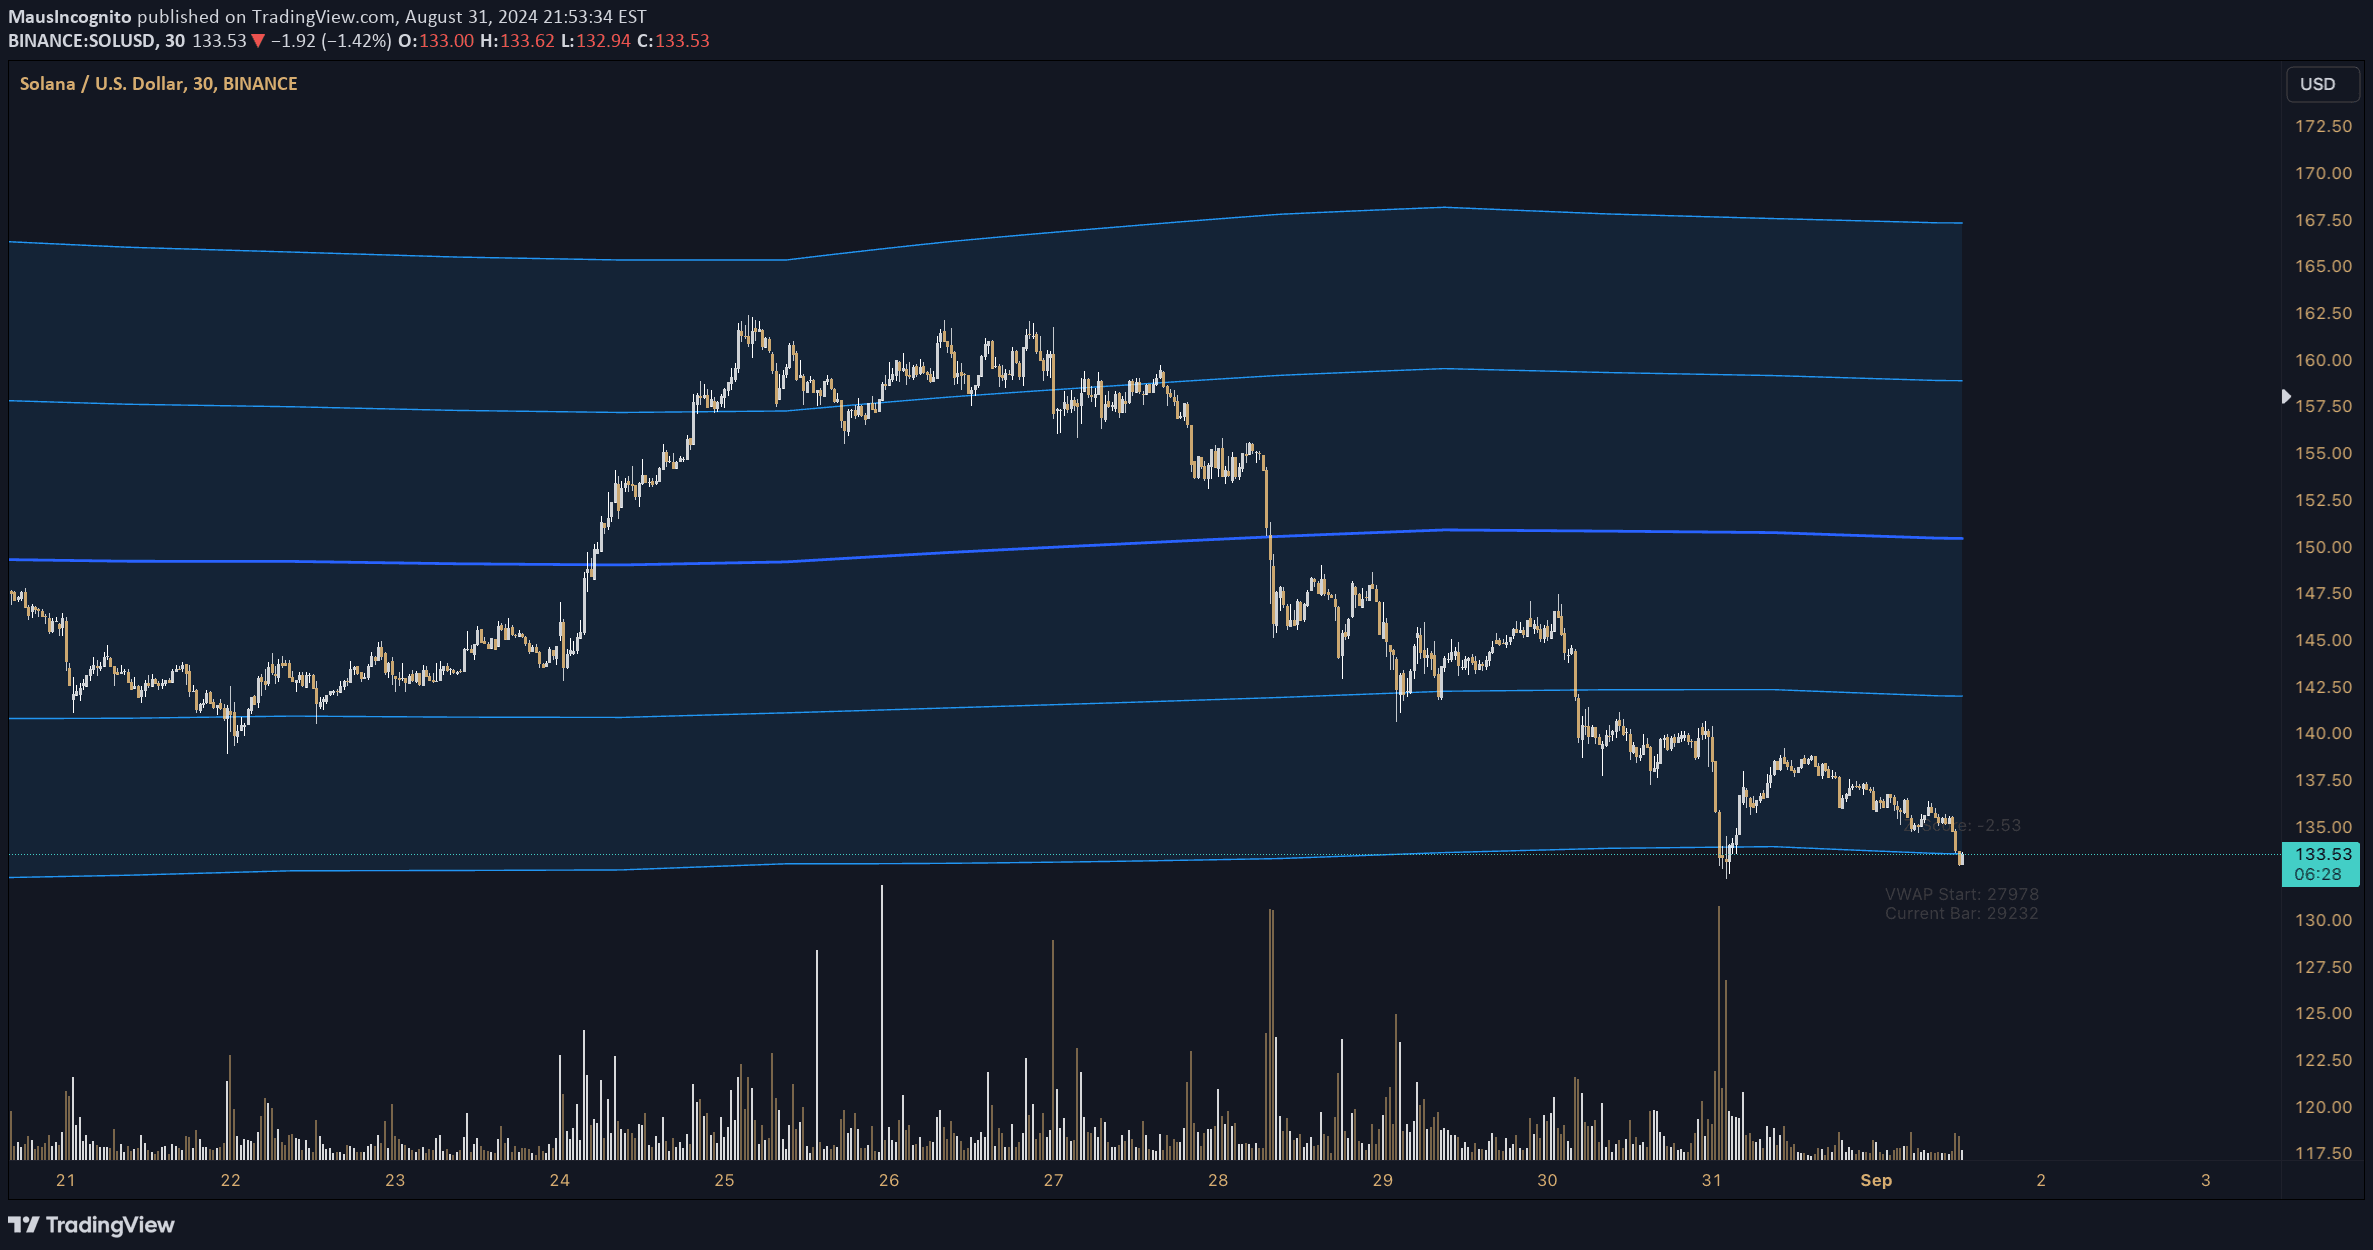
A dynamic VWAP indicator that uses Z-Score analysis to reset and adapt VWAP calculations based on significant volume changes, providing responsive trading insights.
A market momentum indicator that identifies rapid shifts from oversold to strong market conditions, signaling potential bullish momentum when specific percentage thresholds are crossed.
TVMA is a unique lagging moving average that generates crossover signals for buying and selling decisions by tracking price trends with adjustable lag parameters.
A unique FIR filter using trigonometric waves to create a smooth, adaptable trading signal with controllable response time and undershoot characteristics.
Likes, views, and comments are historical TradingView snapshots. They describe attention, not trading performance.