YOUR INDICATOR RESEARCH STARTS HERE

Find the right indicator.
Understand what it does.

Explore 11,183 indicators. Filter beyond the obvious.
Discover the tools that fit the way you trade.

THE INDICATOR LIBRARY

Results for “TTI”

11,183 tools to explore

44 indicators matching your filters
Save search
VolumeVolatilityEditor’s pick

Anti-Volume Stop Loss

by Rafka

An advanced stop-loss strategy that uses volume, price, and volatility to dynamically adjust stop-loss levels, helping traders manage risk by considering individual security characteristics.

Main price chart · unverifiedDay Trading · Swing Trading
Explore
6Klikes155.2Kviews56comments
Save
TrendLevels

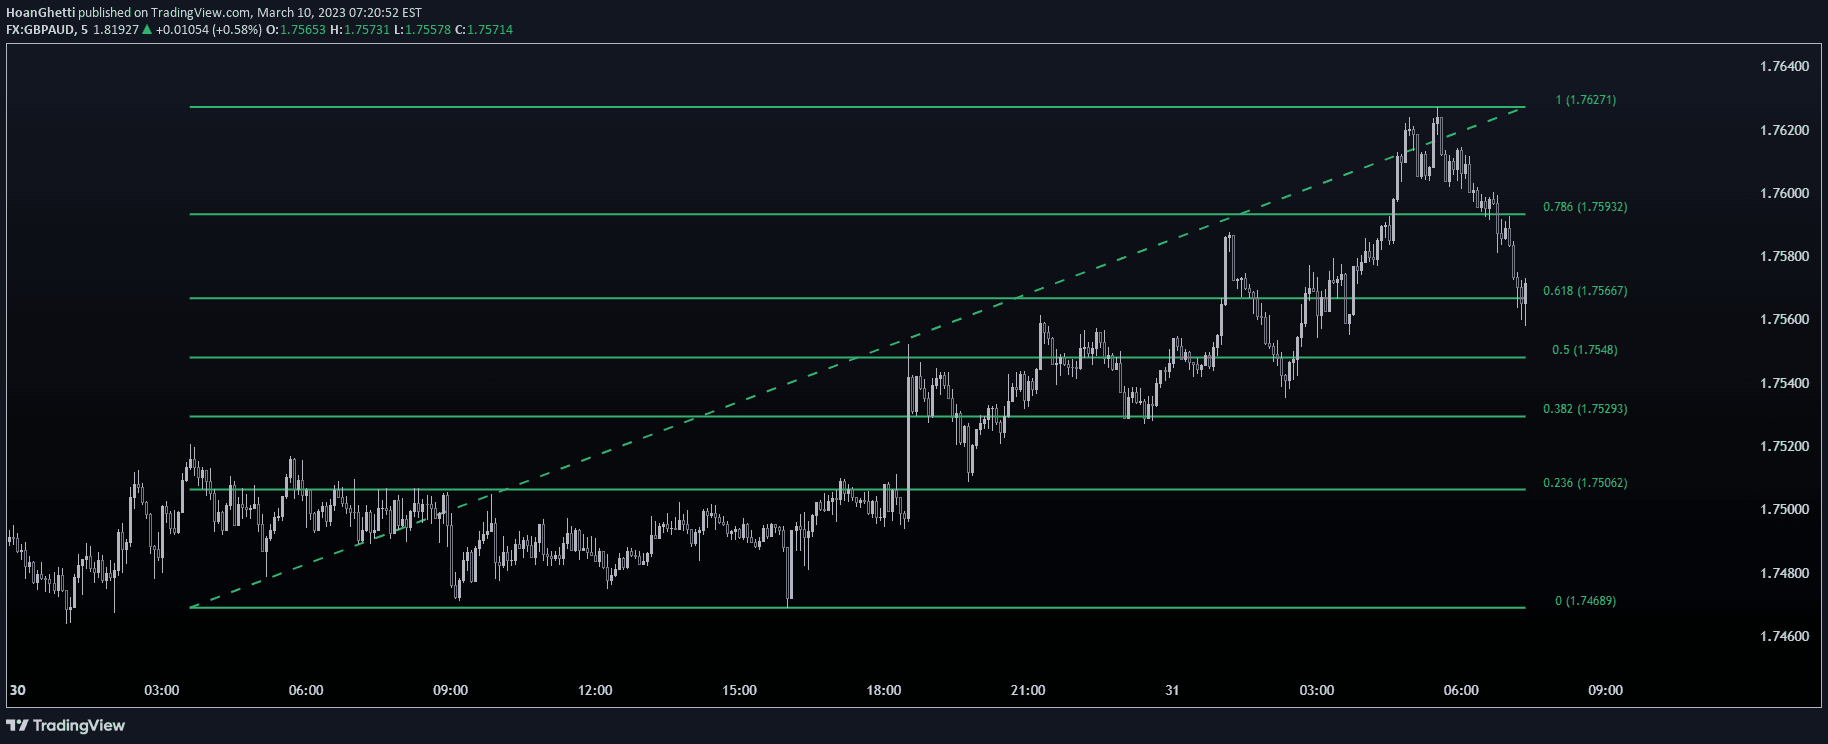
Dynamic Fibonacci Retracement

by HoanGhetti

A dynamic Fibonacci retracement tool that automatically adjusts trendlines and levels based on current price movement, providing adaptive support and resistance analysis.

Main price chart · unverifiedScalping · Day Trading
Explore
1.6Klikes31.8Kviews33comments
Save
PatternsSignalTrend

Sushi Trend [HG]

by HoanGhetti

The Sushi Roll is a trading pattern designed to identify potential market reversals by analyzing the engulfing behavior of a series of price bars across two consecutive periods.

Main price chart · unverifiedDay Trading · Swing Trading
Explore
700likes13.7Kviews16comments
Save
TrendEditor’s pick

Simple Trendlines

by HoanGhetti

Simple Trendlines is a Pine Script library that helps traders easily draw and manage trendlines with automatic slope calculation and built-in strict mode for precise line drawing.

Main price chart · unverifiedSwing Trading
Explore
399likes14.7Kviews24comments
Save
MomentumSignalTrend

ScalpSwing Pro Setup

by MarketTipsy

A multi-timeframe trading tool combining EMA, VWAP, RSI, and MACD to generate buy and sell signals across scalping and swing trading strategies.

Main chart + separate pane · unverifiedScalping · Day Trading
Explore
396likes4.9Kviews0comments
Save
SignalLevels

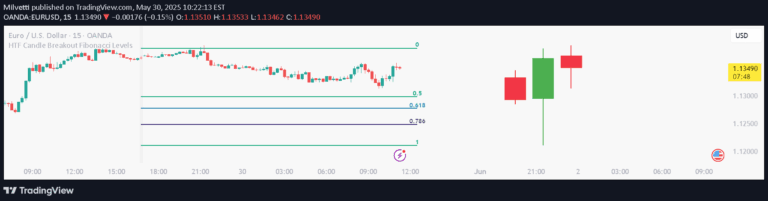
HTF Candle Breakout Fibonacci Levels

by Milvetti

A dynamic Fibonacci retracement indicator that automatically plots levels on a lower timeframe after detecting a breakout on a higher timeframe, providing contextual trading opportunities.

Main price chart · unverifiedScalping · Day Trading
Explore
378likes4.8Kviews0comments
Save
MomentumOscillatorSignal

RSI Accumulation/Distribution [M]

by Milvetti

An RSI-based indicator that identifies accumulation and distribution areas by tracking price direction changes when RSI remains outside standard bands for extended periods.

Separate pane · unverifiedScalping · Day Trading
Explore
371likes7.4Kviews2comments
Save
TrendVolatilityEditor’s pick

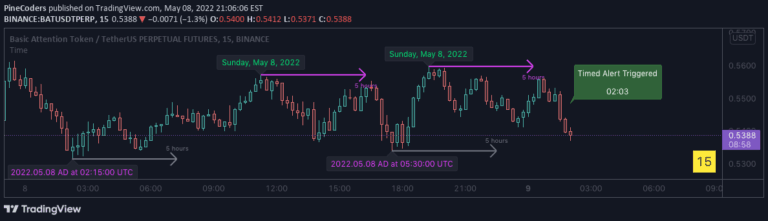
Time

by PineCoders

A Pine Script library offering advanced time manipulation functions to format timestamps, calculate time offsets, and convert time units for precise trading analysis and visualization.

Main price chart · unverifiedDay Trading · Swing Trading
Explore
302likes29.7Kviews35comments
Save

Likes, views, and comments are historical TradingView snapshots. They describe attention, not trading performance.

START WITH A QUESTION

A little less searching.
A lot more understanding.

Tell DeepAlpha what you need. Get an explanation, a shortlist,
and a direct path to the indicators behind it.

Ask DeepAlpha