SPY Expected Move by VIX
A volatility indicator using VIX to measure price deviation from VWAP, primarily designed for SPY. It calculates standard deviation moves based on implied volatility, helping traders understand potential price ranges.
Explore 11,183 indicators. Filter beyond the obvious.
Discover the tools that fit the way you trade.
11,183 tools to explore
A volatility indicator using VIX to measure price deviation from VWAP, primarily designed for SPY. It calculates standard deviation moves based on implied volatility, helping traders understand potential price ranges.
TTP VIX Spy is a trading indicator that uses VIX momentum to identify potential market entry points by analyzing fear and risk in the market through MACD and RSI filters.
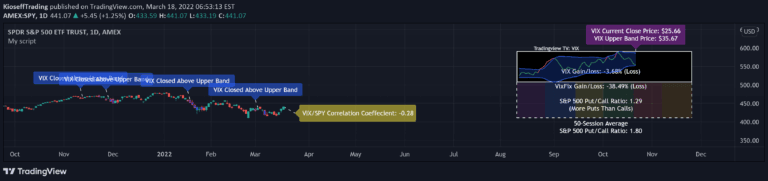
A VIX-based indicator that analyzes volatility correlation with asset prices, tracking VIX/VixFix movements and calculating potential market performance after specific volatility conditions.
Multi-timeframe Williams Vix Fix Indicator that detects market volatility extremes, providing precise insights into potential price reversals across different trading timeframes.
A comprehensive options volatility analysis tool that evaluates market conditions through historical volatility metrics, benchmarking, and regime detection to guide strategic options trading decisions.
A market regime indicator using CBOE's Implied Correlation and VIX to identify bull or bear market environments and assess overall market risk levels.
The Vix Fix is a synthetic volatility indicator that measures market fluctuations by calculating the percentage difference between the current low and the highest close over 22 days.
A trading strategy using India VIX to calculate potential high and low targets for BankNifty and Nifty by analyzing volatility across different timeframes.
VIX HeatMap visualizes market volatility levels across seven distinct zones, helping traders understand current market fear and potential price movement dynamics.
A dynamic support and resistance indicator using VIX volatility that generates intraday trading levels to help traders identify potential entry and exit points based on market sentiment.
A VIX-based trading signal that analyzes market sentiment by measuring volatility, correlations between VIX, S&P 500, and a specific stock to predict potential price movements.
A trading strategy using support and resistance levels calculated based on the volatility index, helping traders identify potential price movement zones for the day.
Likes, views, and comments are historical TradingView snapshots. They describe attention, not trading performance.