Fair value bands / quantifytools
Fair value bands assess price behavior by tracking deviations from a mean basis, helping traders identify normal and abnormal price movements through dynamic statistical bands.
Explore 11,183 indicators. Filter beyond the obvious.
Discover the tools that fit the way you trade.
11,183 tools to explore
Fair value bands assess price behavior by tracking deviations from a mean basis, helping traders identify normal and abnormal price movements through dynamic statistical bands.
A Bollinger Bands upgrade using Nadaraya-Watson estimator to reduce noise and provide smoother price movement analysis with weighted kernel smoothing.
A multi-faceted crypto trading indicator that tracks liquidation ranges, volume/OI dots, and identifies high-volume price areas using advanced volume and open interest analysis.
An indicator that estimates contract liquidation prices by analyzing abnormal changes in open interest and generating liquidation lines across different leverage levels.
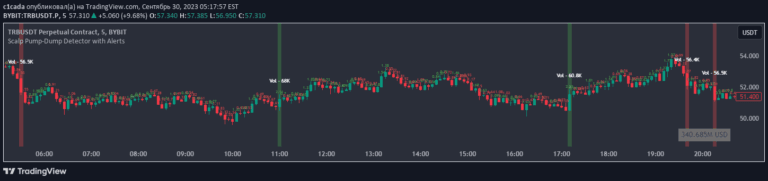
A script that tracks percentage movements of chart candles and identifies abnormal price movements, allowing traders to set alerts for significant price changes.
An indicator tracking abnormal changes in contract positions, similar to RSI, which helps identify potential liquidation market situations and overbought or oversold conditions.
A technical indicator that identifies and highlights abnormal trading volume clusters, helping traders detect significant market events and potential price movements.
A yield curve indicator tracking the percentage of Treasury Bond yield spreads that are inverted, providing insights into potential economic downturns and market sentiment.
A scalping trading system using 4 EMA lines to identify trend direction and potential entry points in major currency pairs with precise rules for buying and selling.
An advanced trading tool that detects unusual price movements by analyzing candle size and volume, helping traders identify potential breakouts and significant market events.
A real-time indicator that detects abnormal purchase volume spikes, helping traders identify potential large player (whale) trading activity in the market.
A volume-based indicator that monitors abnormal trading volume, identifies triple volume bars, and detects potential large order entries in the market.
Likes, views, and comments are historical TradingView snapshots. They describe attention, not trading performance.