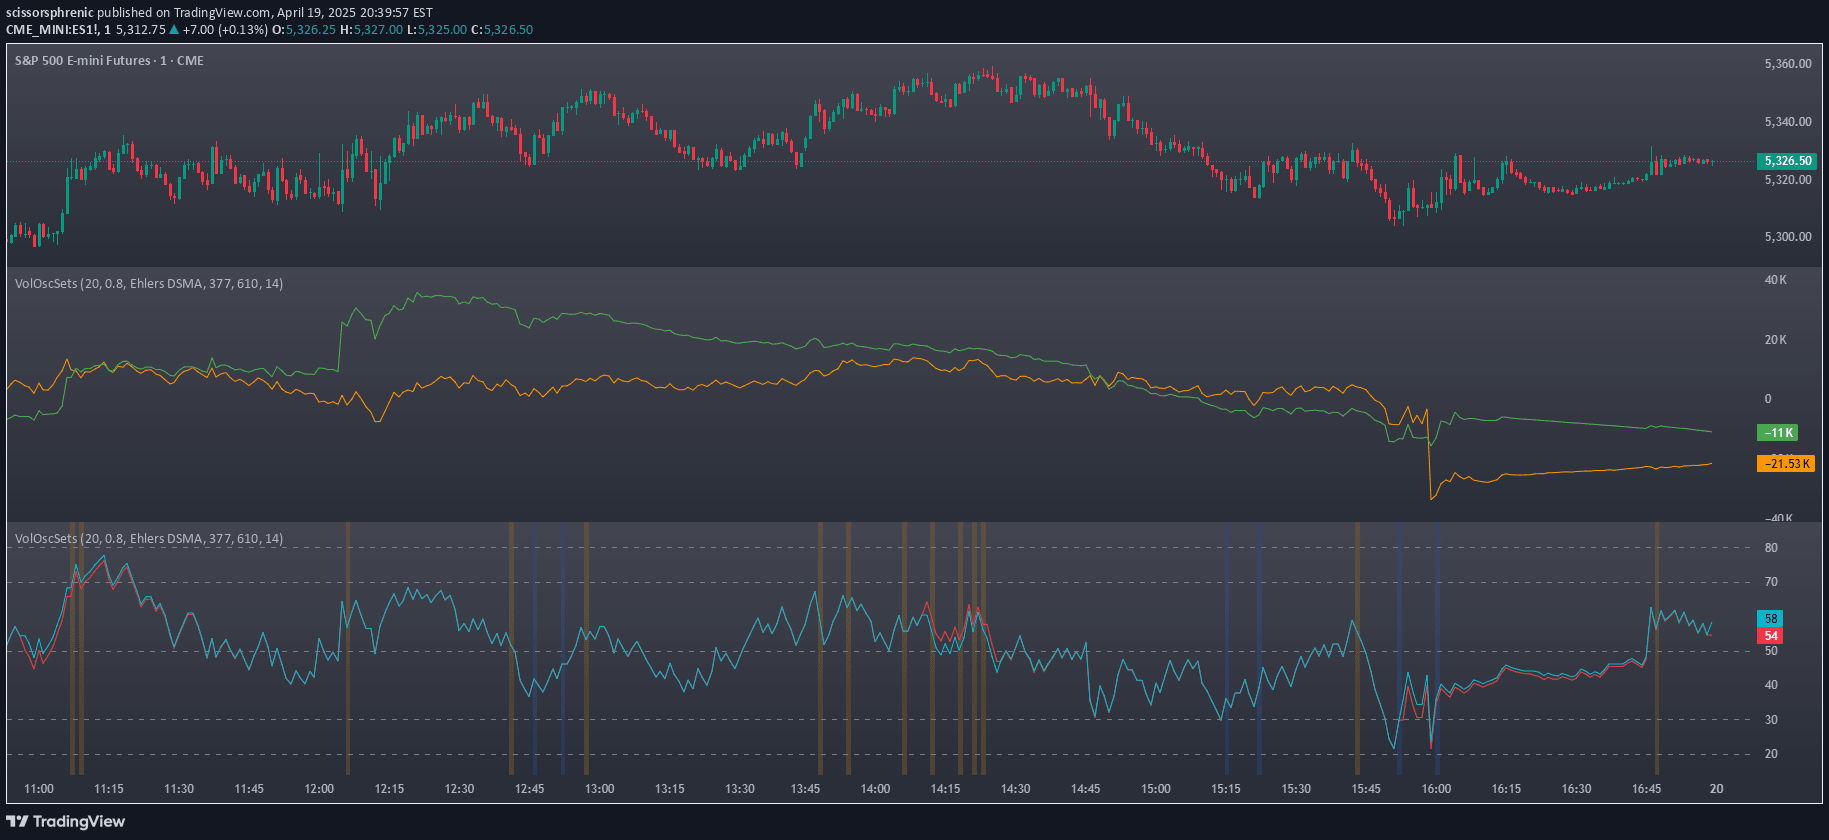
A technical indicator that identifies and highlights abnormal trading volume clusters, helping traders detect significant market events and potential price movements.
Explore complementary indicator rolesHow it works
The indicator analyzes trading volume by comparing current volume against a user-defined threshold for a specific time period. It determines volume clusters by tracking price movements and classifying volume as buy or sell based on price direction.
The script retrieves volume data from a lower timeframe and calculates whether volumes are generated by buyers or sellers. When volume exceeds the set threshold, it marks the cluster with a circle, with the circle's size proportional to the volume's magnitude relative to recent maximum volumes.
Why it may be useful
Volume clusters provide critical insights into market dynamics by revealing unusual trading activity that might signal significant market events or participant intentions. They help traders identify potential price movements, institutional investments, market manipulations, or reactions to important news.
By highlighting abnormal trading volumes, the indicator allows traders to detect early signs of substantial market shifts, offering valuable context for understanding underlying market sentiment and potential trend changes.
When to explore it
This indicator works best during periods of high market activity or when significant economic events are expected. Traders should use it to supplement other technical analysis tools and confirm potential trading signals by observing volume clusters in conjunction with price action.
It is particularly useful for short-term traders seeking to identify rapid market movements, detect potential entry or exit points, and understand the dynamics of buying and selling pressure within a specific timeframe.
Keep exploring
What we’ve verified
Access, alerts and repainting behaviour have not been independently verified for this indicator. Check the creator’s current publication and settings.
General descriptions and classifications are recovered research. Verified details above identify the specific checks we have completed. Check the creator’s current publication for later changes.