Trend Lines [LuxAlgo]
A dynamic trendline indicator that detects and highlights support/resistance lines in real-time, with customizable filters for angle, length, and break detection across different market conditions.
Explore 11,183 indicators. Filter beyond the obvious.
Discover the tools that fit the way you trade.
11,183 tools to explore
A dynamic trendline indicator that detects and highlights support/resistance lines in real-time, with customizable filters for angle, length, and break detection across different market conditions.
A comprehensive technical analysis tool combining Fibonacci and Gann fan/retracements to identify potential support, resistance, and price movement levels across multiple chart perspectives.
The Gann Box is a technical analysis tool that uses geometric principles to identify potential support and resistance levels, forecast price movements, and analyze market trends.
An advanced Fibonacci-based trading indicator that automatically plots pivot point boxes, offering customizable retracement levels, time zones, and visual alerts for market analysis.
A sophisticated trading indicator using Square of Nine methodology to forecast potential support and resistance levels by analyzing market pivots and price progression across geometric angles.
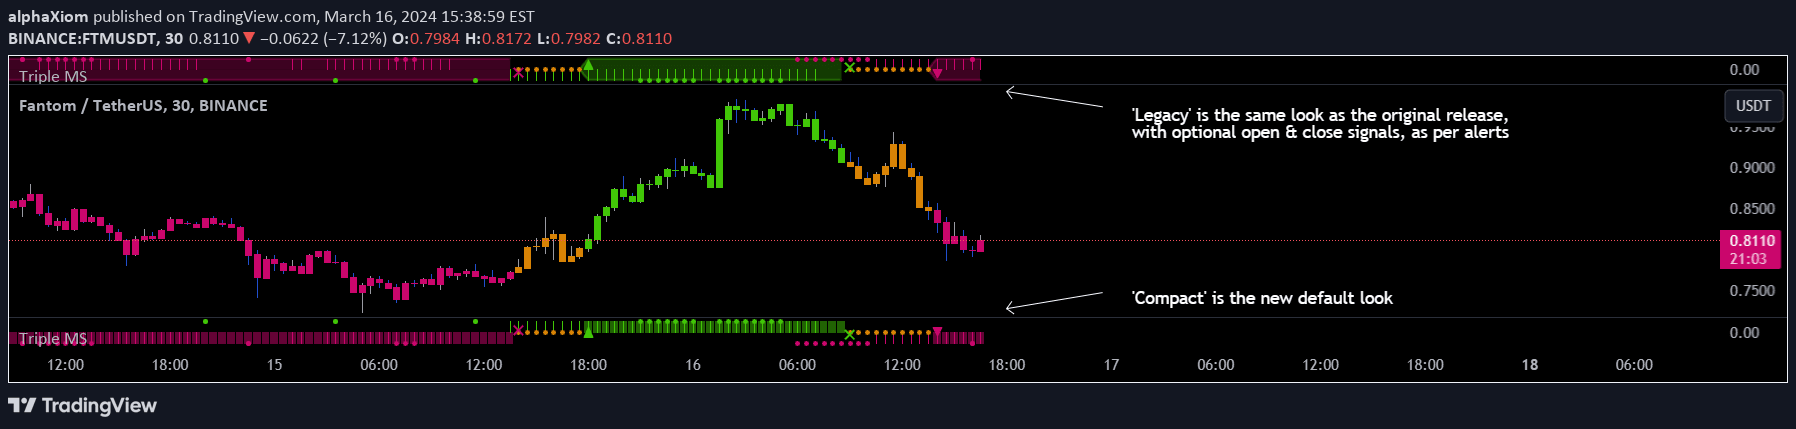
Triple Ehlers Market State is an advanced trend identification indicator that uses three correlation cycles to determine market states with refined bullish, bearish, and trendless signals.
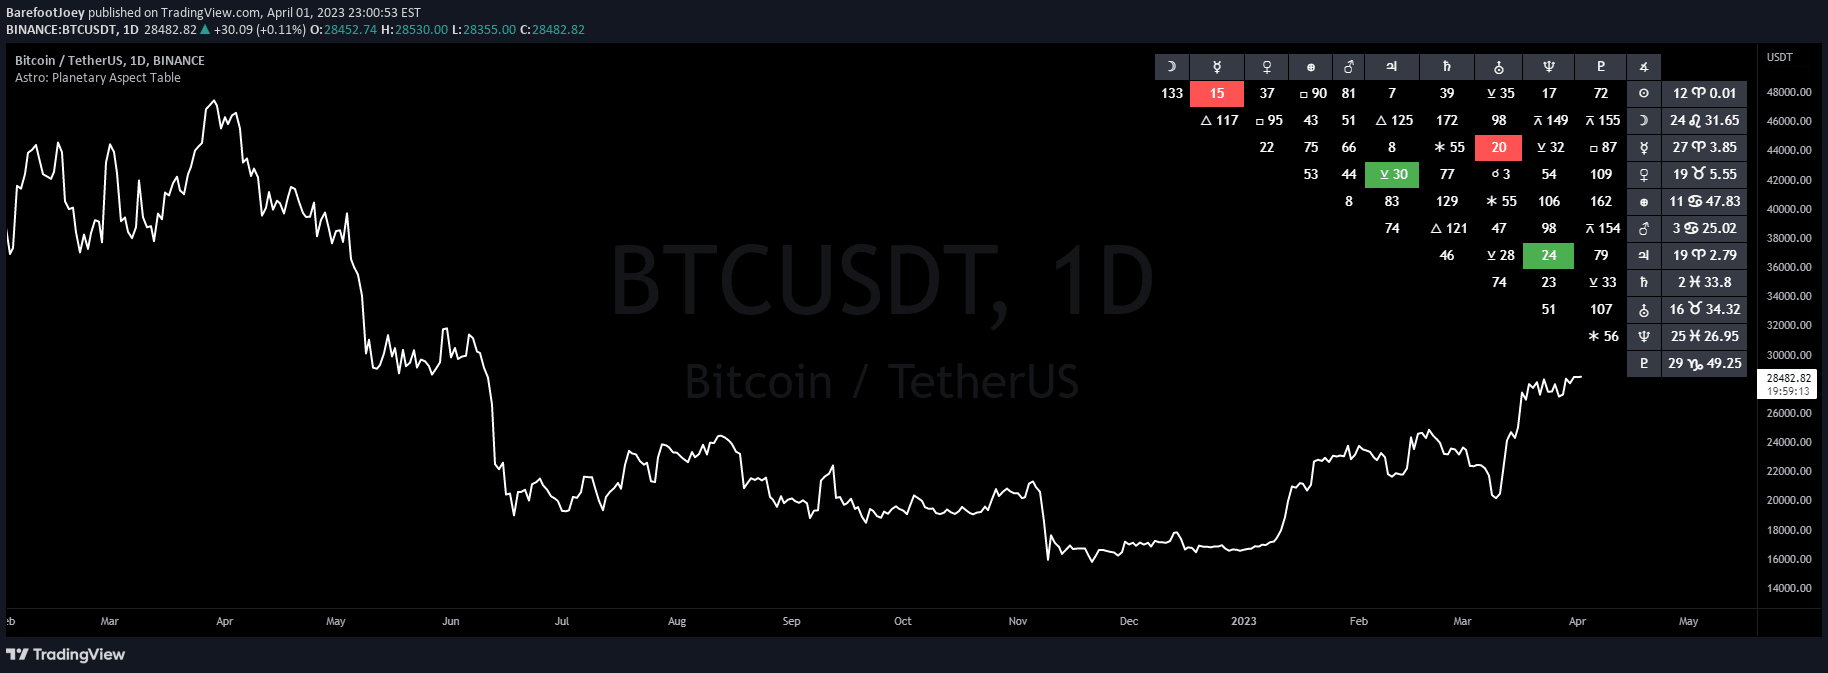
A planetary aspect oscillator that tracks the angular relationships between planets, offering unique insights into potential market influences through astrological energy measurements.
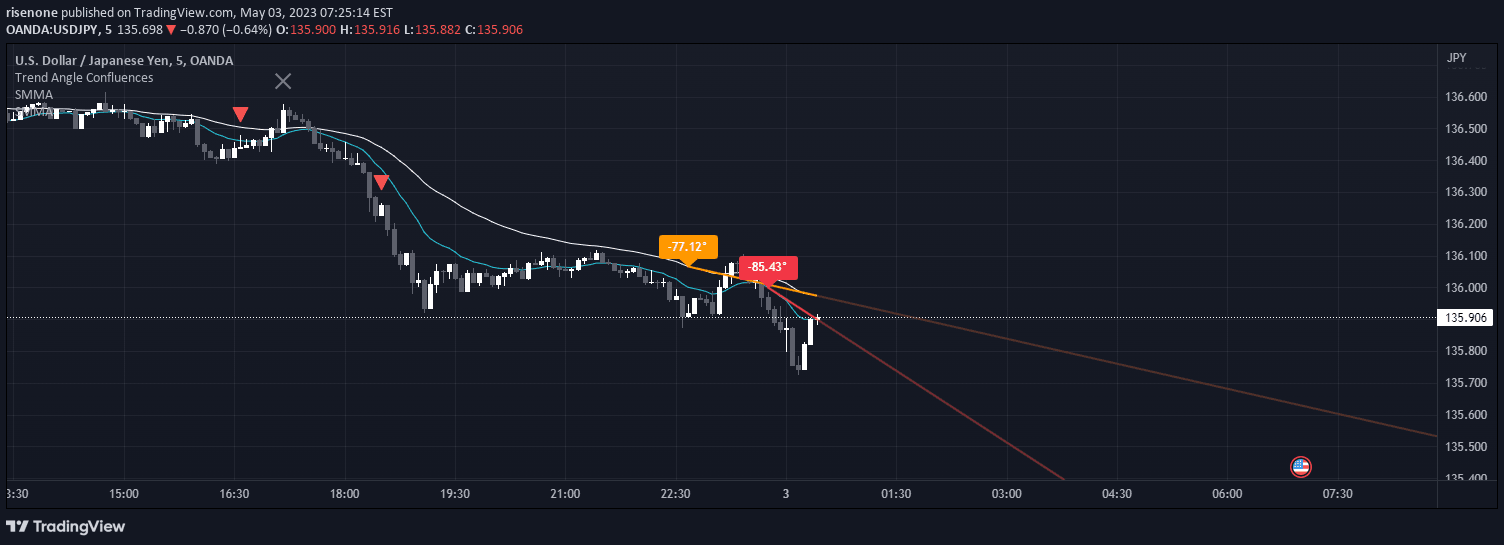
A technical analysis method that detects the angle of exponential moving averages to generate trading signals and identify potential market directional changes.
A dynamic trading indicator that tracks market swing points, identifies historical price movements, and projects potential future support and resistance levels using Gann-style analysis.
A planetary aspects chart overlay displaying real-time interplanetary angular relationships between celestial bodies, tracking their positions and potential energetic influences.
A trading indicator that creates upward and downward triangles to identify dynamic support and resistance levels based on price action and geometric ratios.
A trend analysis indicator that evaluates market direction by calculating the angle of price movement over a selected look-back period and color-coding trend strength.
Likes, views, and comments are historical TradingView snapshots. They describe attention, not trading performance.