Monte Carlo Range Forecast [DW]
A Monte Carlo simulation tool that forecasts potential price ranges using complex pseudorandom generation techniques, providing probabilistic insights into market movement scenarios.
Explore 11,183 indicators. Filter beyond the obvious.
Discover the tools that fit the way you trade.
11,183 tools to explore
A Monte Carlo simulation tool that forecasts potential price ranges using complex pseudorandom generation techniques, providing probabilistic insights into market movement scenarios.
An indicator approximating the intrabar point of control (POC) using time or volume data. It helps traders identify price points with the highest market participation across different time frames.
A dynamic probability indicator that estimates the likelihood of price closing above or below specified levels within a current trading bar, helping traders make informed decisions.
A script that estimates funding rates for Binance USDT pairs by calculating premium index rates, providing traders with insights into potential market sentiment and positioning.
A trading indicator that helps visualize potential profit and loss targets by calculating offset levels through bid-ask spread approximation or percentage-based method.
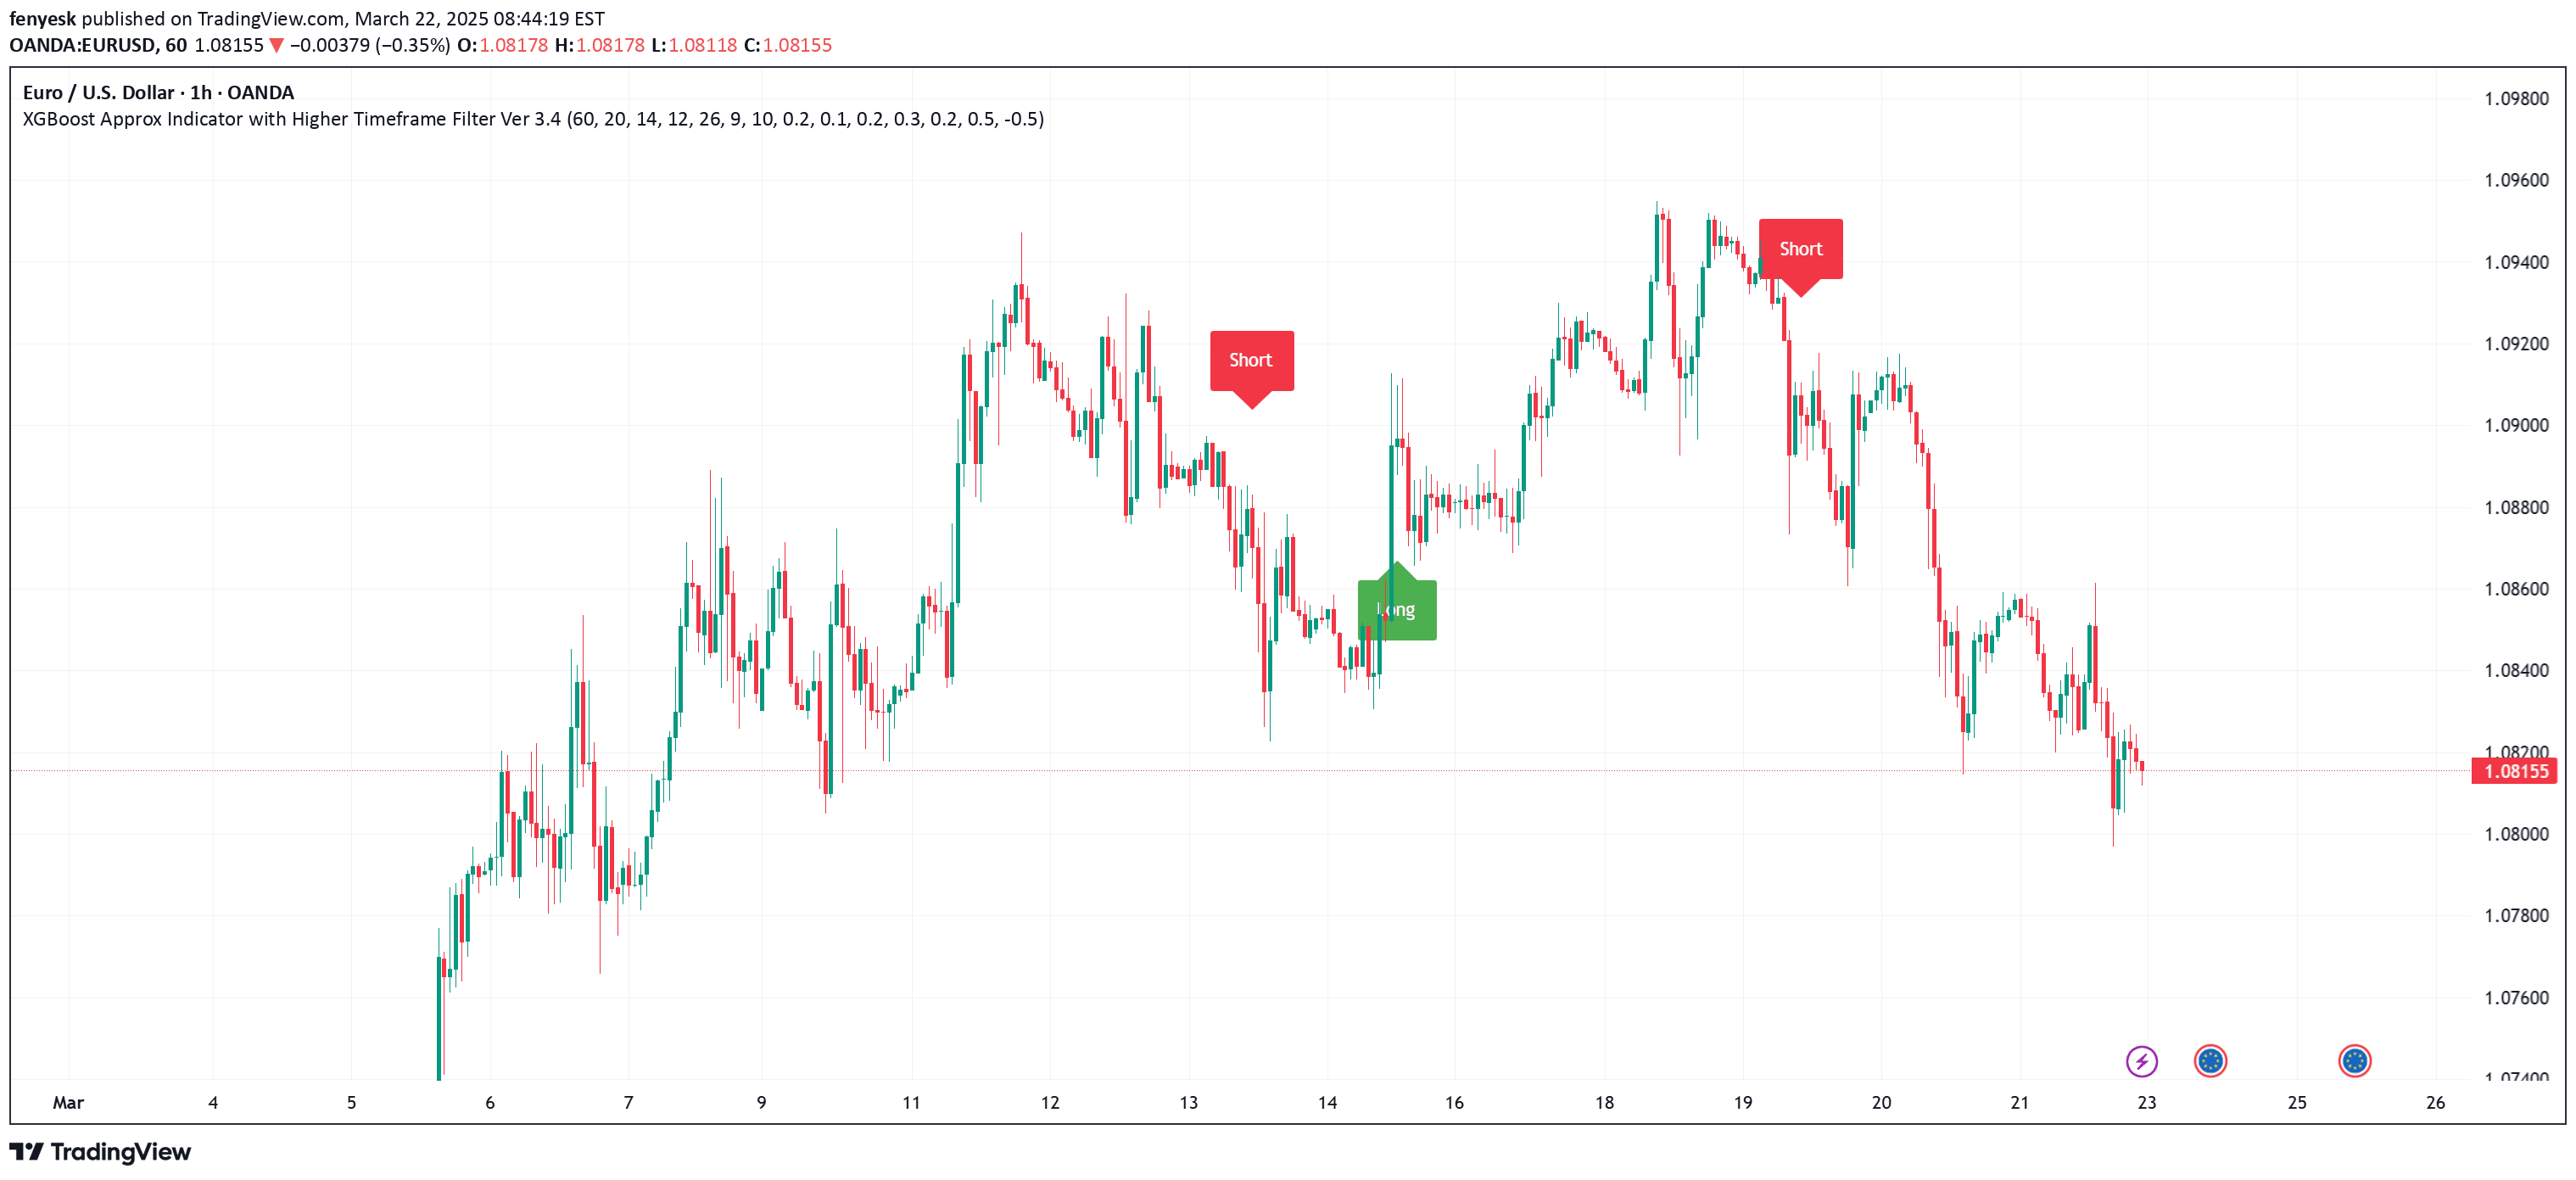
An advanced technical analysis tool using XGBoost machine learning to generate trading signals by combining multiple indicators and applying a higher timeframe filter for trend confirmation.
An advanced volume indicator using linear prediction to estimate current bar's trading volume before it closes, providing early insights into potential market movements.
A trigonometric-based indicator that uses Taylor Series approximations to analyze price movements, providing a smoothed mathematical component with dynamic scaling.
A TradingView approximation of a Footprint Chart that estimates buy and sell volume distribution for each candlestick, providing insights into market order flow dynamics.
A Discounted Cash Flow (DCF) indicator that calculates stock valuation using Free Cash Flow and Weighted Average Cost of Capital with color-coded visualization.
An entropy-based indicator that identifies potential support and resistance zones by measuring price predictability and proximity to significant psychological levels.
A custom entropy indicator that analyzes trading volume randomness through a sophisticated natural logarithm function, providing insights into market stability and potential volatility shifts.
Likes, views, and comments are historical TradingView snapshots. They describe attention, not trading performance.