YOUR INDICATOR RESEARCH STARTS HERE

Find the right indicator.
Understand what it does.

Explore 11,183 indicators. Filter beyond the obvious.
Discover the tools that fit the way you trade.

THE INDICATOR LIBRARY

Results for “array”

11,183 tools to explore

86 indicators matching your filters
Save search
MomentumOscillatorSignal

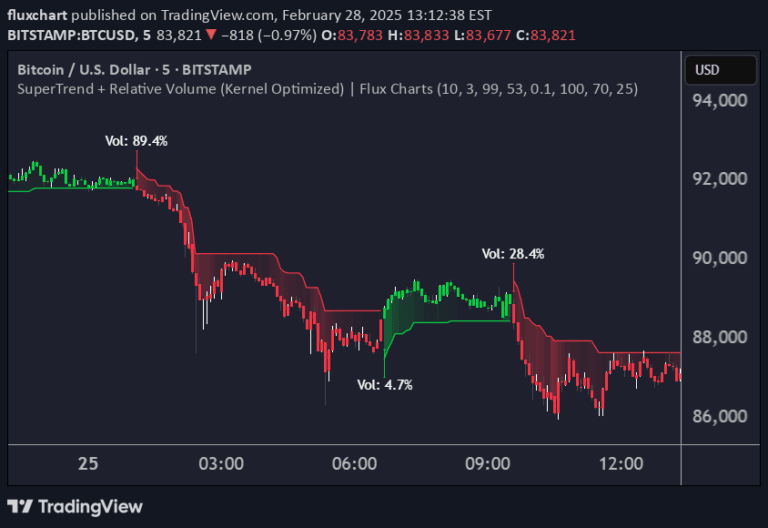
RSI (Kernel Optimized) | Flux Charts

by fluxchart

A specialized RSI indicator using Kernel Density Estimation to predict potential pivot points by analyzing historical RSI patterns and calculating probability of price reversals.

Separate pane · unverifiedScalping · Day Trading
Explore
5.9Klikes98.1Kviews23comments
Save
MomentumEditor’s pick

Logistic RSI, STOCH, ROC, AO, ... by DGT

by dgtrd

An experimental trading signal applying the Logistic Map Equation to popular indicators like Awesome Oscillator, ROC, RSI, and Stochastic to generate unique market insights through iterative mathematical calculations.

Separate pane · unverifiedSwing Trading
Explore
5.5Klikes140.8Kviews104comments
Save
VolumeEditor’s pick

Tick Data Detailed

by LonesomeTheBlue

A tick data analysis tool that breaks down trading volume into different levels, revealing trading activity from different market participant types and detecting potential volume anomalies.

Separate pane · unverifiedScalping · Day Trading
Explore
4.3Klikes79.3Kviews93comments
Save
VolumeEditor’s pick

Volume Profile Auto [line]

by fikira

A volume profile indicator that visualizes trading volume across different time frames using lines and boxes, providing unique insights into volume distribution and market activity.

Separate pane · unverifiedDay Trading · Swing Trading
Explore
4.3Klikes182Kviews51comments
Save
VolumeTrendEditor’s pick

Rolling VWAP

by TradingView

Rolling Volume-Weighted Average Price (RVWAP) is a dynamic indicator that calculates a moving average price weighted by volume across a flexible time window, adapting to different chart timeframes.

Main price chart · unverifiedDay Trading · Swing Trading
Explore
3.9Klikes124.1Kviews74comments
Save
MomentumVolatilityEditor’s pick

Monte Carlo Range Forecast [DW]

by DonovanWall

A Monte Carlo simulation tool that forecasts potential price ranges using complex pseudorandom generation techniques, providing probabilistic insights into market movement scenarios.

Main price chart · unverifiedDay Trading · Swing Trading
Explore
3.5Klikes72.6Kviews79comments
Save
TrendMomentumEditor’s pick

Polynomial Regression Bands + Channel [DW]

by DonovanWall

A polynomial regression indicator that calculates complex curve-fitting relationships between price variables, enabling advanced trend analysis and least squares moving average (LSMA) generation.

Main price chart · unverifiedDay Trading · Swing Trading
Explore
2Klikes61.6Kviews42comments
Save
TrendVolatilityEditor’s pick

Resampling Filter Pack [DW]

by DonovanWall

A flexible price filtering tool that resamples and analyzes market data using multiple methods and advanced moving average techniques to reduce noise and identify underlying price trends.

Main price chart · unverifiedDay Trading · Swing Trading
Explore
1.9Klikes28.6Kviews32comments
Save
LevelsSignal

ICT Friday's Asian Range°

by toodegrees

An ICT trading technique focusing on liquidity draw potential for the next trading week by analyzing Friday's Asian Range on 5 and 15-minute charts.

Main price chart · unverifiedScalping · Day Trading
Explore
1.3Klikes24.3Kviews9comments
Save

Likes, views, and comments are historical TradingView snapshots. They describe attention, not trading performance.

START WITH A QUESTION

A little less searching.
A lot more understanding.

Tell DeepAlpha what you need. Get an explanation, a shortlist,
and a direct path to the indicators behind it.

Ask DeepAlpha