Fair Value Gaps (Volumetric) | Flux Charts
A Fair Value Gaps (FVG) indicator with volumetric analysis that identifies price zones, shows total volume, and provides bullish/bearish volume ratios for trading insights.
Explore 11,183 indicators. Filter beyond the obvious.
Discover the tools that fit the way you trade.
11,183 tools to explore
A Fair Value Gaps (FVG) indicator with volumetric analysis that identifies price zones, shows total volume, and provides bullish/bearish volume ratios for trading insights.
BjCandlePatterns is a comprehensive Japanese candlestick pattern recognition library that detects and labels various trading patterns to help traders identify potential market reversals and trend changes.
An advanced technical analysis script exploring the security() function in Pine Script, focusing on preventing repainting and understanding multi-timeframe data retrieval techniques.
Advanced Fibonacci-based indicator tracking Inverse Fair Value Gaps, revealing potential support and resistance levels through retracement zones and market imbalance detection.
A Pin Bar indicator that identifies four unique candlestick patterns to help traders recognize potential market reversals and trend continuations across different market conditions.
A Gann Swing Indicator that identifies market trends by analyzing price action through unique bar types and swing movements, helping traders recognize trend direction and potential reversals.
A trading indicator designed for experienced traders to identify and color-code specific bar types like inside, outside, and 2-up/2-down bars with customizable visual references.
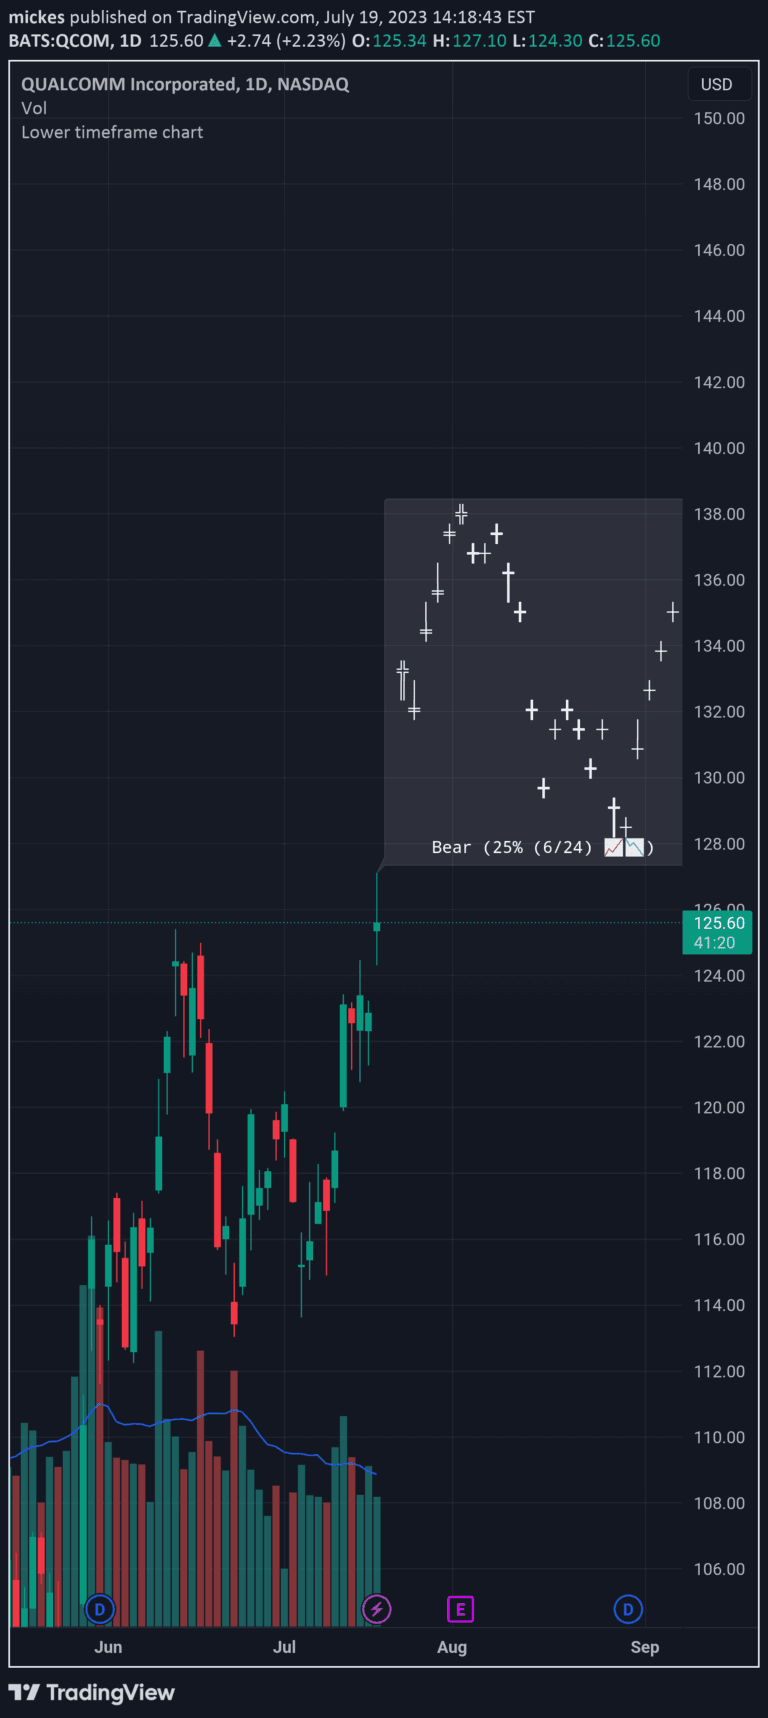
A custom trading script that visualizes lower timeframe bars within the current chart, using SuperTrend indicator and ASCII chart representation to analyze market trends and volume.
Gann counting is a price action method for identifying swing points and market structure by analyzing bar types and their sequential relationships to determine trend direction.
A trading strategy that identifies specific candlestick formations across multiple timeframes to help traders recognize potential price action setups and market dynamics.
A comprehensive trading indicator for ES futures that provides multiple price reference levels, including overnight session data, VIX insights, and customizable support/resistance lines.
Likes, views, and comments are historical TradingView snapshots. They describe attention, not trading performance.