RSI cyclic smoothed v2
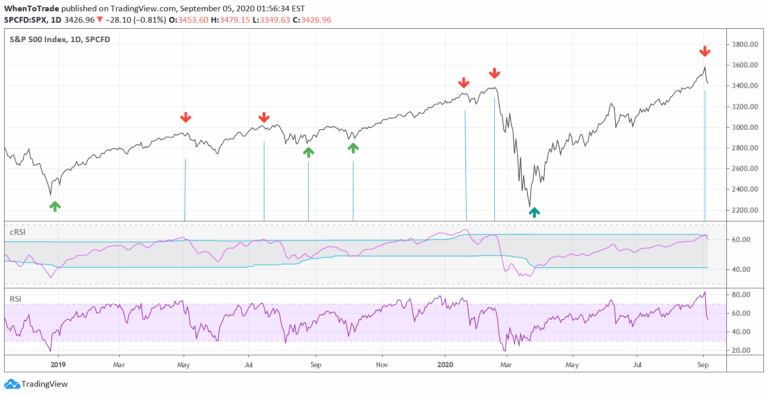
An enhanced RSI indicator that uses cyclic smoothing and adaptive bands to provide more responsive market trend signals by incorporating dominant cycle length.
Explore 11,183 indicators. Filter beyond the obvious.
Discover the tools that fit the way you trade.
11,183 tools to explore
An enhanced RSI indicator that uses cyclic smoothing and adaptive bands to provide more responsive market trend signals by incorporating dominant cycle length.
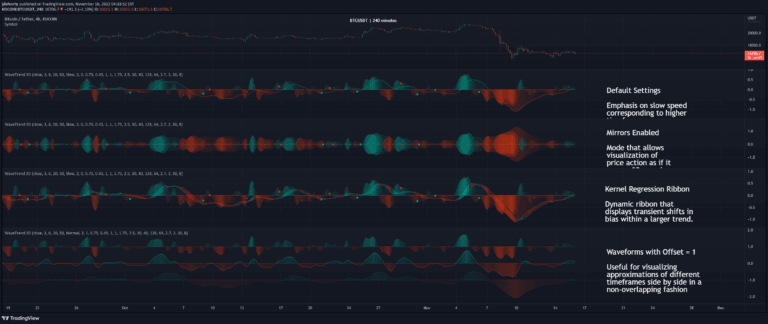
WaveTrend 3D is an advanced oscillator that uses digital signal processing and machine learning techniques to analyze price trends with enhanced precision and multi-timeframe support.
A technical indicator that highlights previous day's high and low points, uses daily and weekly separators to create a clean chart that helps traders understand potential market direction.
A dynamic support and resistance level indicator that scores potential trading zones based on volume, bounce frequency, and price interactions, providing visual insights into market structure.
A dynamic MACD-powered support and resistance mapping tool that generates structural levels based on momentum crossovers, helping traders identify potential market reversal and continuation zones.
A precise indicator that identifies double top and bottom reversal patterns in market price action, helping traders recognize potential trend changes with customizable settings and visual enhancements.
A timing-based indicator that displays key market session ranges, including Asia, London, and New York sessions, with customizable boxes and price level references for intraday trading analysis.
A custom Tradingview indicator designed to display chart information cleanly while providing a personalized watermark for traders seeking discipline and self-mastery.
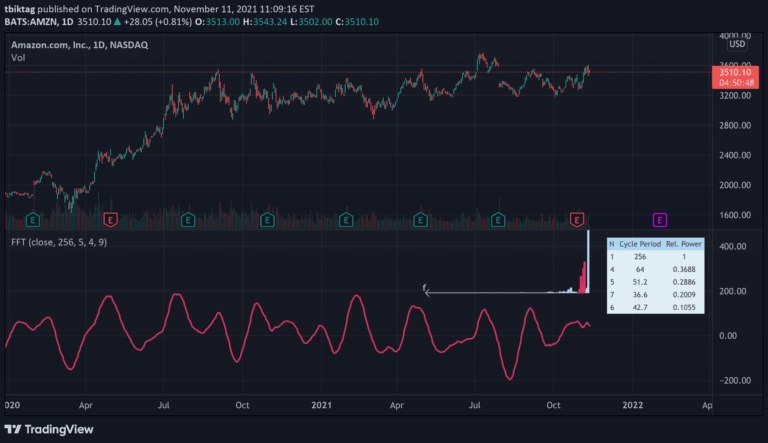
A Fast Fourier Transform (FFT) algorithm that decomposes time series data into cyclical frequency components, enabling advanced time series filtering and analysis.
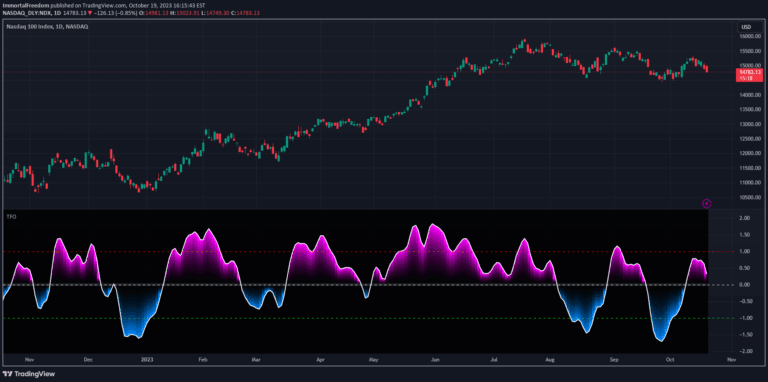
A novel trend oscillator developed by Dr. John Ehlers that provides near zero-lag averaging with consistent performance across multiple timeframes and candle durations.
A highly configurable indicator that tracks previous key price levels across multiple timeframes, allowing traders to identify important support, resistance, and liquidity zones with customizable settings.
A trading strategy focused on identifying market liquidity zones and capturing trend reversals through precise entry points using PM Session range and liquidity hunt techniques.
Likes, views, and comments are historical TradingView snapshots. They describe attention, not trading performance.