Optimized Trend Tracker
Optimized Trend Tracker (OTT) is an advanced indicator designed to identify market trend direction and provide clear buy and sell signals based on price movements relative to the indicator line.
Explore 11,183 indicators. Filter beyond the obvious.
Discover the tools that fit the way you trade.
11,183 tools to explore
Optimized Trend Tracker (OTT) is an advanced indicator designed to identify market trend direction and provide clear buy and sell signals based on price movements relative to the indicator line.
The Adaptive Trend Finder is an advanced trading indicator that autonomously detects trend channels using logarithmic scale regression, offering flexibility in long-term or short-term trend analysis.
Laguerre RSI is a noise-reduced momentum indicator using John EHLERS' Laguerre Filter to analyze market trends by tracking price movement smoothness and potential reversals.
AlphaTrend is a dynamic trend-following indicator that uses Money Flow Index or RSI to generate buy and sell signals based on trend direction and momentum crossovers.
A generalized Gaussian filter that smooths price data with variable pole orders, reducing noise and high-frequency market movements using advanced signal processing techniques.
The Kalman Volume Filter is an advanced volume analysis tool that filters market volume dynamics, revealing potential trend directions and trading opportunities through sophisticated filtering techniques.
The Adaptive Moving Average (AMA) Signals indicator dynamically adjusts to market volatility, providing responsive trend identification and trading signals by measuring market efficiency and price directionality.
A correlation matrix tool that visualizes relationships between 10 different assets, revealing how different securities move in relation to each other using statistical coefficients.
An advanced algorithmic indicator that finds historical price segments matching current market conditions and projects potential future price movements using curve matching technology.
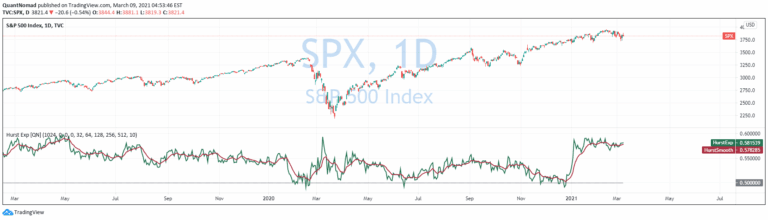
The Hurst Exponent is a statistical measure that evaluates time series behavior, helping traders identify market trends, mean reversion, and potential future price movements.
Historical Correlation tool calculates correlation coefficients between assets, revealing how different financial instruments move in relation to each other over time.
A correlation matrix indicator that calculates Pearson correlation coefficients between multiple financial instruments, revealing how different assets' returns move in relation to each other.
Likes, views, and comments are historical TradingView snapshots. They describe attention, not trading performance.