YOUR INDICATOR RESEARCH STARTS HERE

Find the right indicator.
Understand what it does.

Explore 11,183 indicators. Filter beyond the obvious.
Discover the tools that fit the way you trade.

THE INDICATOR LIBRARY

Results for “combine”

11,183 tools to explore

859 indicators matching your filters
Save search
TrendMomentumEditor’s pick

Divergence for Many Indicators v4

by LonesomeTheBlue

Advanced trading tool that detects divergences across multiple technical indicators, helping traders identify potential trend reversals and momentum shifts through comprehensive pivot point analysis.

Main price chartDay Trading · Swing Trading
Explore
23.6Klikes661Kviews695comments
Save
VolumeSignalLevels

Liquidity Swings [LuxAlgo]

by LuxAlgo

A liquidity indicator that highlights swing areas with trading activity, tracking price revisits, accumulated volume, and potential support/resistance zones using customizable filtering.

Main price chart · unverifiedDay Trading · Swing Trading
Explore
17.9Klikes731.9Kviews131comments
Save
TrendMomentumEditor’s pick

Divergence Indicator (any oscillator)

by yatrader2

A versatile divergence indicator that identifies potential trend reversals by comparing price action with an oscillator's momentum, adaptable to multiple technical indicators.

Separate pane · unverifiedDay Trading · Swing Trading
Explore
10.4Klikes218.8Kviews153comments
Save
MomentumEditor’s pick

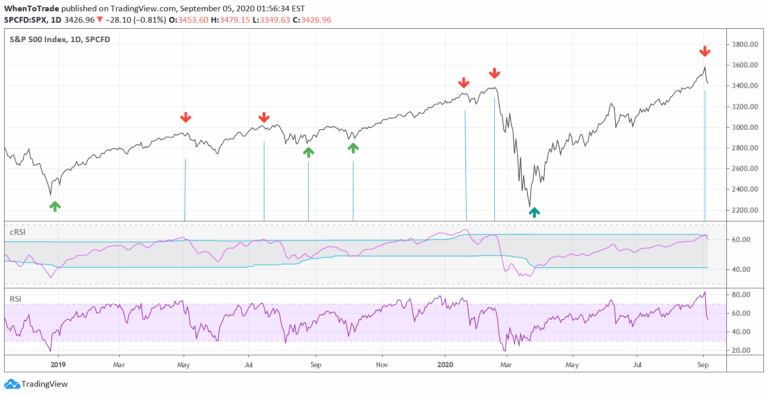
RSI cyclic smoothed v2

by StockMarketCycles

An enhanced RSI indicator that uses cyclic smoothing and adaptive bands to provide more responsive market trend signals by incorporating dominant cycle length.

Separate pane · unverifiedSwing Trading
Explore
10.4Klikes338.4Kviews106comments
Save
VolumeEditor’s pick

Tick Chart

by LonesomeTheBlue

Tick Chart is a unique charting method that creates candlesticks based on a specific number of price ticks, offering an alternative to time-based charts for analyzing market movements.

Main price chart · unverifiedScalping · Day Trading
Explore
7.5Klikes149.3Kviews105comments
Save
PatternsSignalTrend

2B Reversal Pattern (Expo)

by Zeiierman

The 2B reversal pattern identifies potential market trend reversals by detecting false breakouts and price rebounds, signaling opportune entry points for traders.

Main price chart · unverifiedScalping · Day Trading
Explore
7.3Klikes147.6Kviews60comments
Save
TrendVolatilityEditor’s pick

Renko Candles Overlay

by LonesomeTheBlue

Renko Candles Overlay is a charting technique that transforms price action into uniform-sized bricks, offering a simplified visual representation of market trends and price movements.

Main price chart · unverifiedDay Trading · Swing Trading
Explore
6.6Klikes169.7Kviews135comments
Save
Volatility

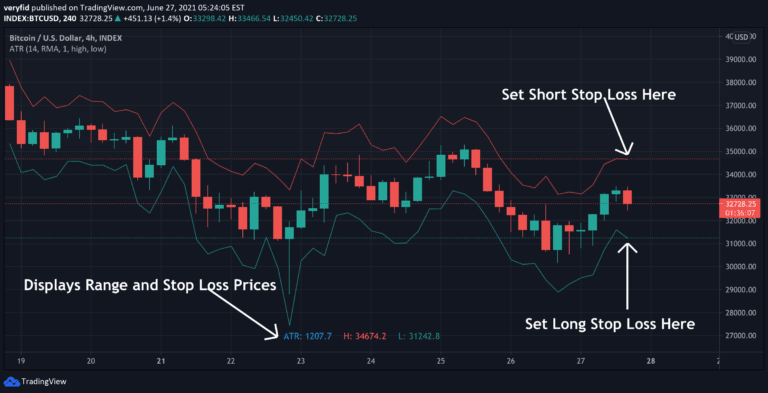
ATR Stop Loss Finder

by veryfid

An ATR-based indicator that helps traders set adaptive stop losses by calculating safe exit points using volatility measurement. Prevents premature stop-outs and provides dynamic risk management.

Main price chart · unverifiedDay Trading · Swing Trading
Explore
6.2Klikes228.2Kviews129comments
Save
Trend

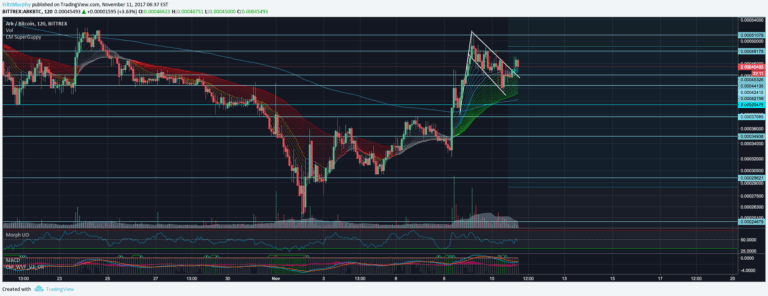
CM Super Guppy

by FritzMurphy

An enhanced Exponential Moving Average (EMA) script based on the Super Guppy format, designed to provide advanced trend analysis by utilizing multiple EMA lengths for comprehensive market insights.

Main price chart · unverifiedDay Trading · Swing Trading
Explore
6.2Klikes83.2Kviews13comments
Save
OscillatorSignalTrend

Moving Average Shift [ChartPrime]

by ChartPrime

A customizable moving average indicator that combines trend analysis with mean reversion detection, offering dynamic candle coloring and an oscillator to identify potential price shifts.

Separate pane · unverifiedScalping · Day Trading
Explore
6.2Klikes91Kviews36comments
Save

Likes, views, and comments are historical TradingView snapshots. They describe attention, not trading performance.

START WITH A QUESTION

A little less searching.
A lot more understanding.

Tell DeepAlpha what you need. Get an explanation, a shortlist,
and a direct path to the indicators behind it.

Ask DeepAlpha