Heikin Ashi RSI Oscillator
HARSI is a unique oscillator combining Heikin Ashi candles with RSI calculations, designed to reduce noise and provide smoother trend analysis for traders.
Explore 11,183 indicators. Filter beyond the obvious.
Discover the tools that fit the way you trade.
11,183 tools to explore
HARSI is a unique oscillator combining Heikin Ashi candles with RSI calculations, designed to reduce noise and provide smoother trend analysis for traders.
A multi-timeframe support and resistance indicator that identifies key price zones, tracks breaks and retests, and provides comprehensive market trend analysis for traders.
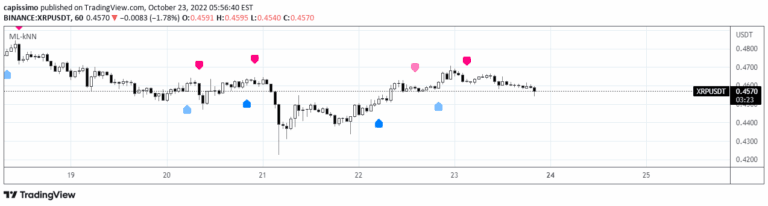
A k-Nearest Neighbours machine learning strategy that predicts market moves by analyzing historic data and finding similar past market conditions to forecast future price directions.
A trend-following indicator that dynamically detects market direction using SMA bands and provides automated visual cues for entries, stops, and targets directly on the chart.
An advanced Fibonacci Retracement tool that automatically draws levels on various technical indicators, helping traders identify potential support and resistance zones.
The Commitment of Traders (COT) report analyzes market positions of commercial, large, and small traders to provide strategic trading insights and market sentiment.
A trading indicator that combines CCI/Momentum and RSI to identify potential market reversals by detecting extreme price points and momentum shifts.
Trendline Pivot Indicator automatically draws and recognizes dynamic trend lines connecting pivot highs and lows, providing visual support and resistance reference points on price charts.
The Kalman Volume Filter is an advanced volume analysis tool that filters market volume dynamics, revealing potential trend directions and trading opportunities through sophisticated filtering techniques.
An advanced trading tool that reverse engineers oscillator price levels, allowing traders to calculate precise thresholds and analyze momentum from multiple technical indicators.
MavilimW is a moving average indicator that provides color-coded trading signals and identifies trend direction by analyzing price movements across multiple timeframes and symbols.
A comprehensive trend-following indicator using moving averages to identify bullish and bearish market trends across different timeframes with color-coded visual alerts.
Likes, views, and comments are historical TradingView snapshots. They describe attention, not trading performance.