
Volume composition / quantifytools
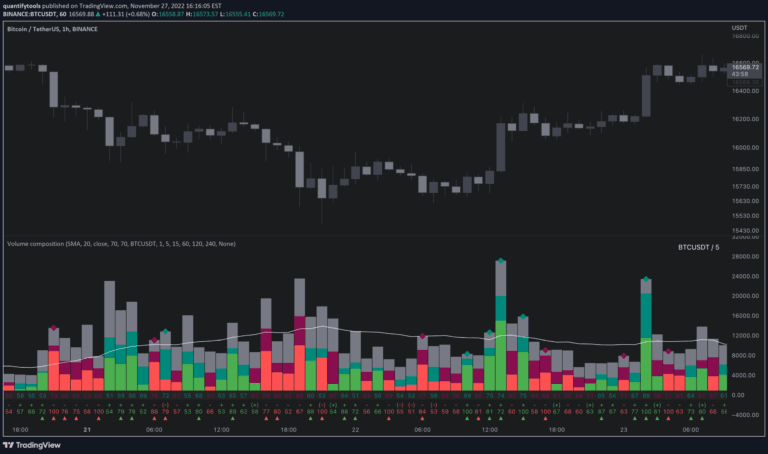
Volume composition indicator that breaks down trading volume into buy, sell, passive, and active components to provide deeper insights into market liquidity and potential price movements.
Explore 11,183 indicators. Filter beyond the obvious.
Discover the tools that fit the way you trade.
11,183 tools to explore
Volume composition indicator that breaks down trading volume into buy, sell, passive, and active components to provide deeper insights into market liquidity and potential price movements.
A dynamic trend oscillator that uses multiple moving average filters to assess market direction, strength, and volatility across different market conditions.
A polynomial regression indicator that calculates complex curve-fitting relationships between price variables, enabling advanced trend analysis and least squares moving average (LSMA) generation.
A composite EMA indicator that compares an asset's closing price with the XU100 index, scaling EMA values to provide unique market trend and support/resistance insights.
A flexible signal adapter script that allows traders to combine up to eight external indicators to create custom trading signals without complex coding, suitable for strategy prototyping.
A Pine Script technique for combining multiple cryptocurrency price data into a single composite ticker using advanced request.security() method, enabling efficient multi-ticker analysis.
A dynamic support and resistance dashboard that visualizes market cycle shifts through dot indicators tracking key technical levels like Ichimoku Cloud and ZLEMA across different price zones.
An advanced market analysis tool that breaks down price data into intrinsic mode functions, revealing hidden market cycles and trends through adaptive signal processing.
A composite moving average that blends four powerful average types to create an ultra-responsive trend signal with minimal lag and enhanced smoothness.
A comprehensive multi-component trading indicator that combines trend, momentum, volume, and volatility analysis to provide actionable market insights and signal generation.
Smart MA is an advanced moving average indicator offering two color-based modes to visualize market trends: Crossing and Direction, which help traders identify potential trend changes and trading opportunities.
Advanced technical indicator using Goertzel algorithm to detect and analyze dominant market cycles, helping traders identify underlying price movement patterns and potential trading opportunities.
Likes, views, and comments are historical TradingView snapshots. They describe attention, not trading performance.