Reversal Signals [LuxAlgo]
A technical analysis tool that identifies potential trend reversals by tracking momentum and trend exhaustion phases across bullish, bearish, and ranging markets.
Explore 11,183 indicators. Filter beyond the obvious.
Discover the tools that fit the way you trade.
11,183 tools to explore
A technical analysis tool that identifies potential trend reversals by tracking momentum and trend exhaustion phases across bullish, bearish, and ranging markets.
A technical analysis indicator that identifies three-bar reversal patterns, helping traders detect potential trend changes by analyzing consecutive price bar formations and their relationships.
MA Sabres is a trend reversal indicator that uses moving averages to detect potential market direction changes and visualize them with sabre-shaped graphical elements.
A multi-timeframe supply and demand indicator that identifies trading zones based on momentum candles, helping traders recognize potential support and resistance levels.
A Fibonacci-based indicator that creates dynamic trading channels and levels using swing highs and lows, helping traders identify potential support, resistance, and trend reversal points.
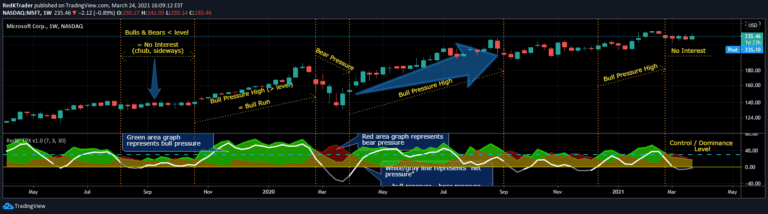
The RedK Trader Pressure Index (TPX) analyzes price bar changes to reveal the ongoing battle between bulls and bears, providing insights into market control and potential price action direction.
An advanced N-bar reversal pattern detector that identifies potential trend reversals by analyzing multiple consecutive candles and their price action, with customizable filtering options.
A trading signal that tracks volume swings by identifying increasing volume and higher highs/lower lows across multiple bars, revealing potential support and resistance levels.
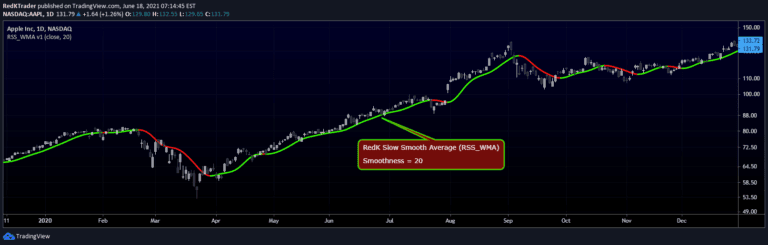
RedK Slow Smooth Average (RSS_WMA) is a specialized moving average designed to provide smooth trend visualization by filtering out short-term price noise through multiple weighted moving average passes.
A sophisticated trading signal that combines trend detection, price rejection logic, and dynamic ATR-based target projection to identify and validate potential trend continuation opportunities.
A sophisticated market cycle detection method that uses Detrended Price Oscillator to identify rhythmic patterns and dominant cycles in price movements, helping traders optimize technical indicator settings.
A technical analysis tool that identifies price gaps between consecutive candlesticks, creating windows that signal potential trend continuation or reversal points.
Likes, views, and comments are historical TradingView snapshots. They describe attention, not trading performance.