YOUR INDICATOR RESEARCH STARTS HERE

Find the right indicator.
Understand what it does.

Explore 11,183 indicators. Filter beyond the obvious.
Discover the tools that fit the way you trade.

THE INDICATOR LIBRARY

Results for “constant”

11,183 tools to explore

68 indicators matching your filters
Save search
Signal

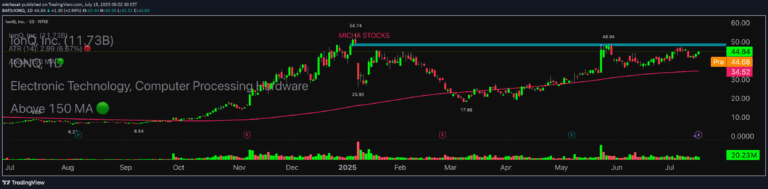
Micha Stocks Custom Watermark

by michacat

A Pine Script v5 indicator that creates a customizable watermark on TradingView charts, displaying key stock information with flexible positioning and formatting options.

Main price chart · unverifiedDay Trading · Swing Trading
Explore
886likes10.9Kviews8comments
Save
SignalTrendVolatility

HMA Gaussian Volatility Adjusted

by Patito_1

A sophisticated trading indicator combining Hull Moving Average with Gaussian filtering and volatility metrics to provide dynamic trend and momentum analysis across different market conditions.

Main price chart · unverifiedScalping · Day Trading
Explore
549likes7.2Kviews0comments
Save
SignalTrend

HTF Candles Overlay [Trendoscope®]

by Trendoscope

HTF Candles Overlay is a visualization tool that displays higher timeframe candles directly on the current chart, helping traders understand broader market context without switching timeframes.

Main price chart · unverifiedScalping · Day Trading
Explore
534likes9.5Kviews13comments
Save
MomentumOscillatorTrend

Normalized KAMA Oscillator | Ikke Omar

by IkkeOmar

A normalized Kaufman Adaptive Moving Average (KAMA) oscillator that measures price efficiency and adapts to market conditions by transforming KAMA into a more dynamic indicator.

Separate pane · unverifiedScalping · Day Trading
Explore
492likes11Kviews9comments
Save
TrendVolatility

SUPeR TReND 2.718

by TheLeadingIndicator

SUPeR TReND 2.718 is an advanced Supertrend indicator using Euler's constant, providing precise trend detection with dynamic visual layers and customizable trend tracking.

Main price chart · unverifiedDay Trading · Swing Trading
Explore
479likes9.2Kviews0comments
Save
MomentumSignal

Straddle Charts - Live

by ChartedHighs

A real-time indicator that displays live prices for call and put options in a straddle strategy, enabling traders to monitor option values and track combined straddle performance dynamically.

Main price chart · unverifiedScalping · Day Trading
Explore
384likes6.2Kviews3comments
Save
SignalTrend

[INVX] Trailing Stop

by InnovestX

A dynamic stop-loss indicator that automatically adjusts price levels based on market movement, helping traders secure profits and manage risk with customizable parameters.

Main price chart · unverifiedScalping · Day Trading
Explore
231likes2.8Kviews2comments
Save
TrendMomentum

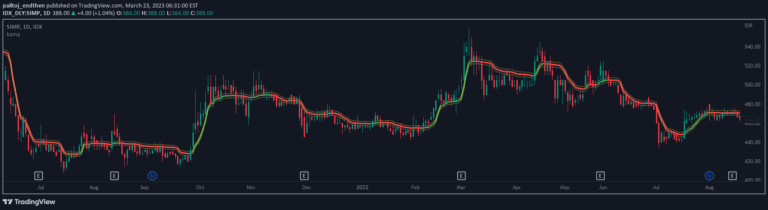
kama

by palitoj_endthen

KAMA is an adaptive moving average that dynamically adjusts its smoothing based on market efficiency, providing a responsive trendline that indicates potential buy or sell signals.

Main price chart · unverifiedDay Trading · Swing Trading
Explore
185likes8Kviews7comments
Save

Likes, views, and comments are historical TradingView snapshots. They describe attention, not trading performance.

START WITH A QUESTION

A little less searching.
A lot more understanding.

Tell DeepAlpha what you need. Get an explanation, a shortlist,
and a direct path to the indicators behind it.

Ask DeepAlpha