Fair Value Gap [LuxAlgo]
Fair Value Gaps (FVG) identify market imbalances between buyers and sellers, highlighting potential support and resistance levels where price movements might reverse or continue.
Explore 11,183 indicators. Filter beyond the obvious.
Discover the tools that fit the way you trade.
11,183 tools to explore
Fair Value Gaps (FVG) identify market imbalances between buyers and sellers, highlighting potential support and resistance levels where price movements might reverse or continue.
The 2B reversal pattern identifies potential market trend reversals by detecting false breakouts and price rebounds, signaling opportune entry points for traders.
MTF Fair Value Gap (FVG) indicator helps traders identify price gaps across multiple timeframes, revealing potential support/resistance zones and trading opportunities.
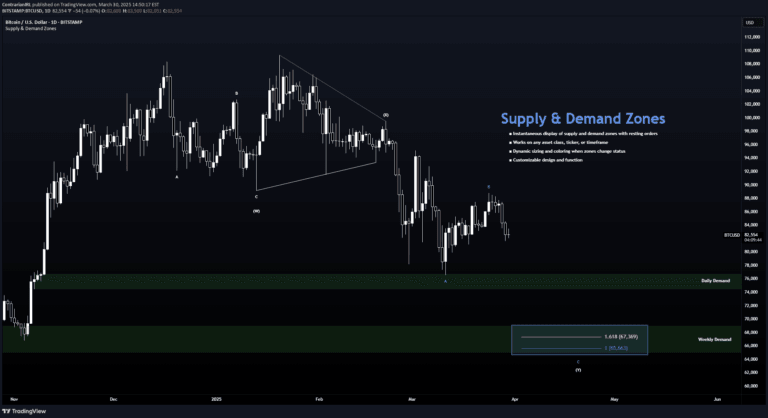
A trading indicator that identifies high-probability supply and demand zones on charts, helping traders locate potential price reversal areas with dynamic visual representation and customizable settings.
The Moving Average Contrarian Indicator identifies potential market turning points by measuring price distance from a moving average and normalizing the values between 0 and 100.
A unique support and resistance indicator that identifies critical price reversal zones using a specialized filtering method and customizable ATR-based proximity alerts.
A time-weighted price action indicator that detects consolidation zones and highlights potential reversal points using contrarian breakout logic to identify market traps.
A market sentiment indicator that quantifies investor emotions by analyzing seven key market factors to determine whether stock prices reflect fear or greed.
A technical analysis tool that identifies market reversals by comparing price momentum to its trend, generating buy and sell signals based on momentum deviation from trend.
A contrarian trading indicator using Donchian Channels to identify potential market reversals with visual stop loss and take profit markers for strategic entry points.
A Put-Call Bias Indicator that analyzes options trading sentiment by measuring the proportion of put options relative to total options contracts using CBOE weekly data.
A multi-length indicator measuring price exhaustion by comparing closing prices to moving averages across different timeframes, revealing overbought and oversold conditions.
Likes, views, and comments are historical TradingView snapshots. They describe attention, not trading performance.