Elliott Wave [LuxAlgo]
Elliott Wave indicator automatically detects impulse and corrective wave patterns in price movements, helping traders identify potential trend directions and market phases.
Explore 11,183 indicators. Filter beyond the obvious.
Discover the tools that fit the way you trade.
11,183 tools to explore
Elliott Wave indicator automatically detects impulse and corrective wave patterns in price movements, helping traders identify potential trend directions and market phases.
A dynamic trend indicator using Zero-Lag Moving Average and EMA to detect market momentum shifts, highlighting trend reversal levels and potential price zones.
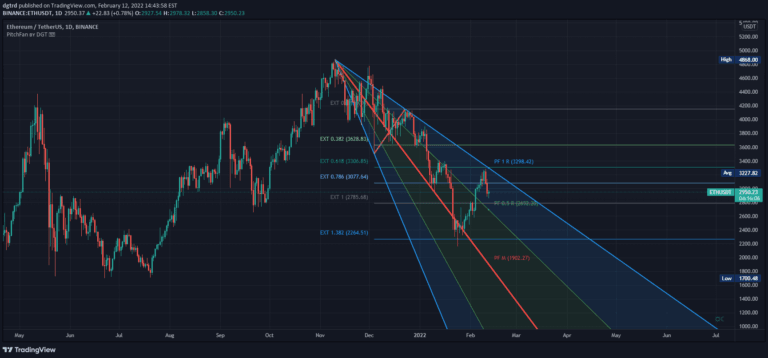
An advanced trading tool combining PitchFan, Fibonacci Extensions/Retracements, and ZigZag to identify potential support, resistance levels, and trend continuation signals.
A comprehensive trading toolkit combining RSI divergences, correction zones, and advanced support/resistance levels to help traders analyze market movements and potential trend reversals.
An advanced trading indicator identifying potential market imbalances through rapid price movements, analyzing order blocks and pivot points to detect areas of potential price revisits.
An advanced trend-following indicator using Kalman Filter technology to dynamically track market trends, adapting to changing conditions through sophisticated statistical algorithms.
Regular Divergence is a technical analysis method that identifies potential trend reversals by comparing price movements with oscillator indicator patterns, revealing hidden market dynamics.
Zigzag is an analytical indicator that connects consecutive price pivots to help traders identify market trends, price waves, and classic chart patterns across different timeframes.
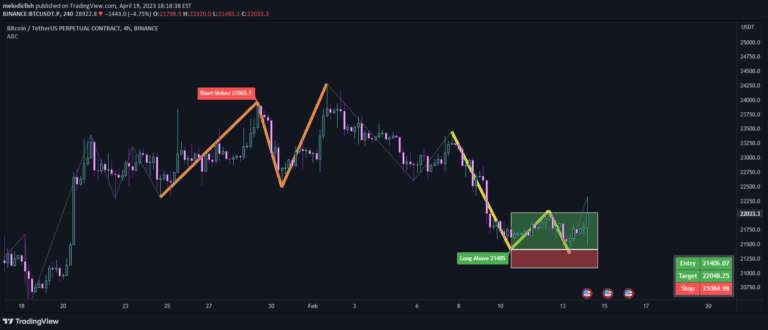
An ABC Pattern finding tool that helps traders identify specific price formations with customizable bar settings and automatic trade box generation for precise entry and exit levels.
ABCD harmonic pattern identifies potential price reversal zones using precise Fibonacci ratios across four points A, B, C, and D in both bullish and bearish market conditions.
A pullback warning indicator that identifies potential market reversals by measuring distances between key moving averages and assessing price extension from a 50-day SMA.
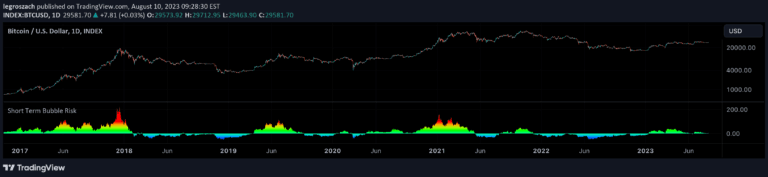
A weekly risk indicator for Bitcoin and Ethereum that measures price extension from the 20-week simple moving average, providing a color-coded risk oscillator to assess short-term market conditions.
Likes, views, and comments are historical TradingView snapshots. They describe attention, not trading performance.