RSI cyclic smoothed v2
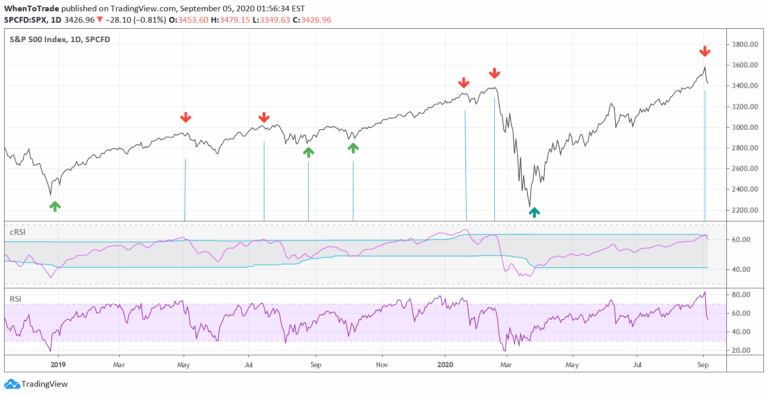
An enhanced RSI indicator that uses cyclic smoothing and adaptive bands to provide more responsive market trend signals by incorporating dominant cycle length.
Explore 11,183 indicators. Filter beyond the obvious.
Discover the tools that fit the way you trade.
11,183 tools to explore
An enhanced RSI indicator that uses cyclic smoothing and adaptive bands to provide more responsive market trend signals by incorporating dominant cycle length.
An advanced Fibonacci Retracement tool that automatically draws levels on various technical indicators, helping traders identify potential support and resistance zones.
An adaptive MACD oscillator that dynamically adjusts to market conditions, filtering noise and capturing trend variations by interpolating between different filter coefficients.
A sophisticated market cycle detection method that uses Detrended Price Oscillator to identify rhythmic patterns and dominant cycles in price movements, helping traders optimize technical indicator settings.
An advanced RSI-based indicator that identifies periods of suppressed volatility, visualizes suppression zones, and highlights potential breakout dynamics in price movements.
A multi-harmonic trigonometric model that extrapolates price trends using Fourier series and Quinn-Fernandes algorithm for predicting future price movements and cycles.
A tool that reveals seasonal price variations by calculating average price changes for specific days across multiple years, helping traders identify recurring market patterns.
A long-term market cycle indicator that compares short and long moving averages to identify potential market tops and bottoms, especially for assets like Bitcoin.
A noise-filtered oscillator using John Ehlers' SuperSmoother filter to identify market trends and mean reversion points with enhanced clarity and precision.
A sophisticated signal processing technique that identifies dominant market cycles by applying linear predictive filters to price data, helping traders adapt strategies to changing market conditions.
A comprehensive Bitcoin trading model that combines power law trend, rainbow chart, and halving cycle wave to provide insights into potential price movements and market cycles.
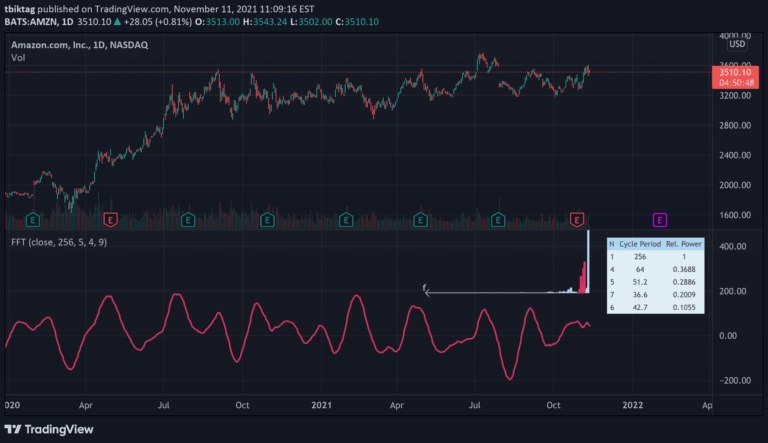
A Fast Fourier Transform (FFT) algorithm that decomposes time series data into cyclical frequency components, enabling advanced time series filtering and analysis.
Likes, views, and comments are historical TradingView snapshots. They describe attention, not trading performance.