
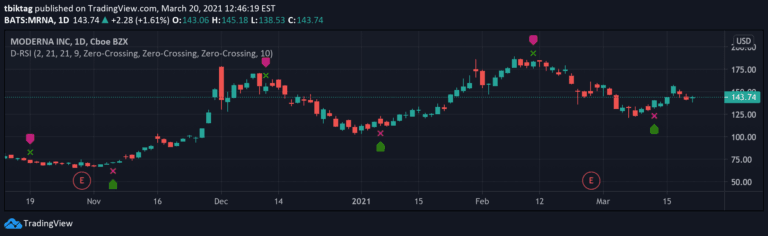
Delta-RSI Oscillator Strategy
Delta-RSI Oscillator is a momentum indicator that measures the rate of change in RSI through a smoothed time derivative, providing dynamic insights into market momentum shifts.
Explore 11,183 indicators. Filter beyond the obvious.
Discover the tools that fit the way you trade.
11,183 tools to explore
Delta-RSI Oscillator is a momentum indicator that measures the rate of change in RSI through a smoothed time derivative, providing dynamic insights into market momentum shifts.
A technique analyzing Donchian Channel percent widths to identify cyclical new price peaks, providing insights into market dynamics and potential trend shifts.
An advanced MACD-based indicator that generates buy and sell signals by analyzing the slope changes of the MACD signal line, providing precise trend momentum insights.
A sector momentum indicator tracking stocks above their 20-day moving average, revealing market sector rotation and potential market corrections through MACD-like analysis.
The Speed of Change indicator measures the rate of price movement, helping traders understand momentum and potential trend acceleration or deceleration in financial markets.
A trading indicator that calculates the number of trades per bar and filters them to identify unusual trading activity, potentially revealing high-frequency bot movements or momentum shifts.
A custom indicator that calculates percentage changes between consecutive candle closes, providing insights into price movement dynamics and potential trading opportunities.
A composite momentum indicator that analyzes market cycles by comparing moving averages and tracking momentum changes to detect potential market tops and bottoms.
Tick Time/Speed indicator visualizes trading speed by measuring time differences between tick bars, providing insights into market momentum and price movement intensity.
A volume-based indicator analyzing the collision of one-hour and four-hour volumes to indicate trend acceleration or deceleration, providing insights into market momentum.
A Kalman filter-based trading indicator that detects trend changes by tracking price direction and velocity, offering signals for potential trend pauses or reversals.
A trading signal that measures the acceleration of moving averages, revealing trend speed and potential strength changes by analyzing percentage variations in moving average movements.
Likes, views, and comments are historical TradingView snapshots. They describe attention, not trading performance.