buysellsignal-yashgode9
A dynamic trading indicator that generates buy and sell signals by analyzing price action using customizable depth, deviation, and backstep parameters for precise market entry and exit points.
Explore 11,183 indicators. Filter beyond the obvious.
Discover the tools that fit the way you trade.
11,183 tools to explore
A dynamic trading indicator that generates buy and sell signals by analyzing price action using customizable depth, deviation, and backstep parameters for precise market entry and exit points.
An indicator that estimates contract liquidation prices by analyzing abnormal changes in open interest and generating liquidation lines across different leverage levels.
A sophisticated trading indicator designed to detect market trend reversals and generate precise buy signals using advanced algorithmic analysis of price movements.
An indicator tracking abnormal changes in contract positions, similar to RSI, which helps identify potential liquidation market situations and overbought or oversold conditions.
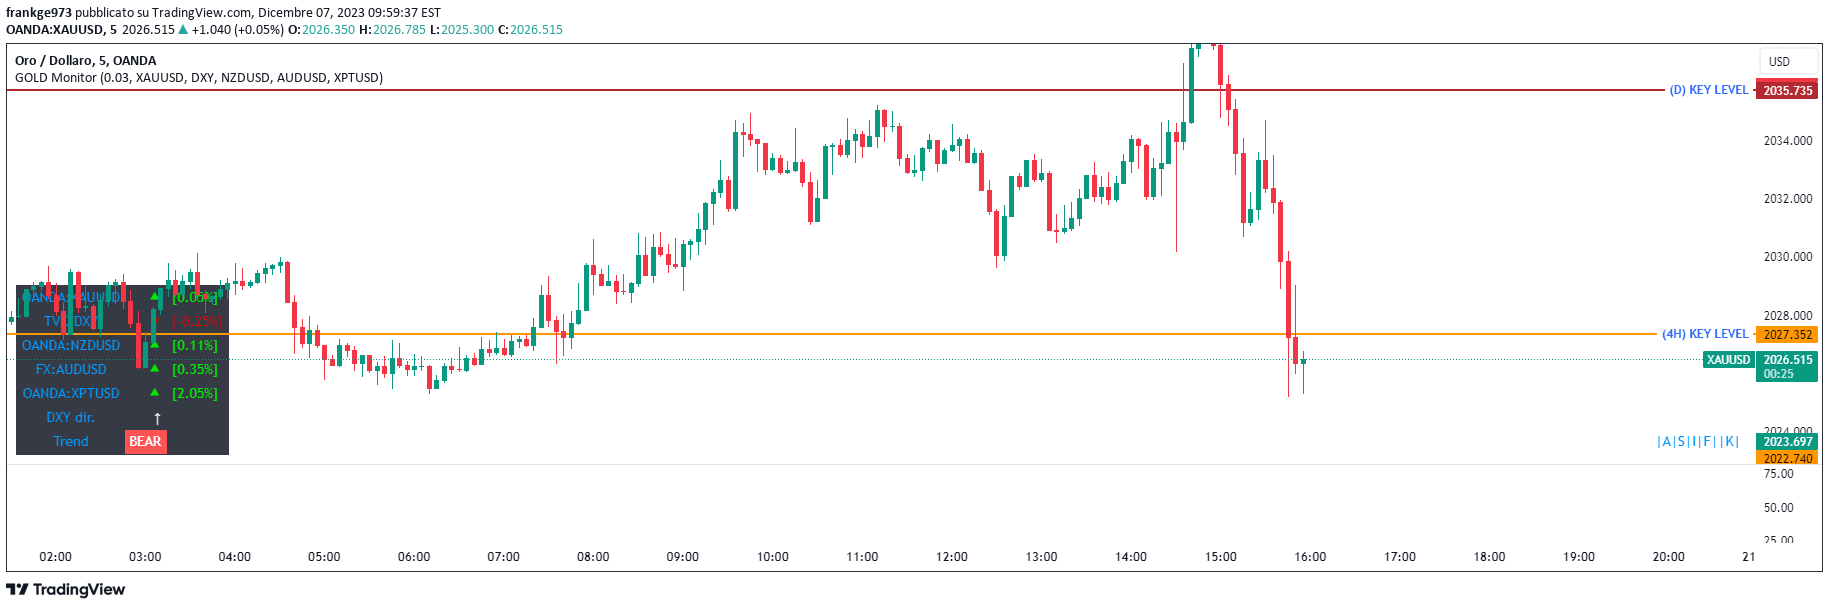
A comprehensive scalping indicator for Gold trading that provides instant market insights by tracking USD strength, related currency pairs, and potential trend directions.
An enhanced VWAP indicator that calculates volume-weighted average price, average price, and average cost from a selected starting point to identify potential market support and resistance zones.
An advanced volume indicator using linear prediction to estimate current bar's trading volume before it closes, providing early insights into potential market movements.
A comprehensive trading suite that provides multi-layered market analysis using moving averages, price tightening indicators, and sector/market dashboards for trend identification.
A specialized indicator tracking the Asia trading session's price dynamics, providing key session highs, lows, and visual markers to help traders understand market behavior during this crucial timeframe.
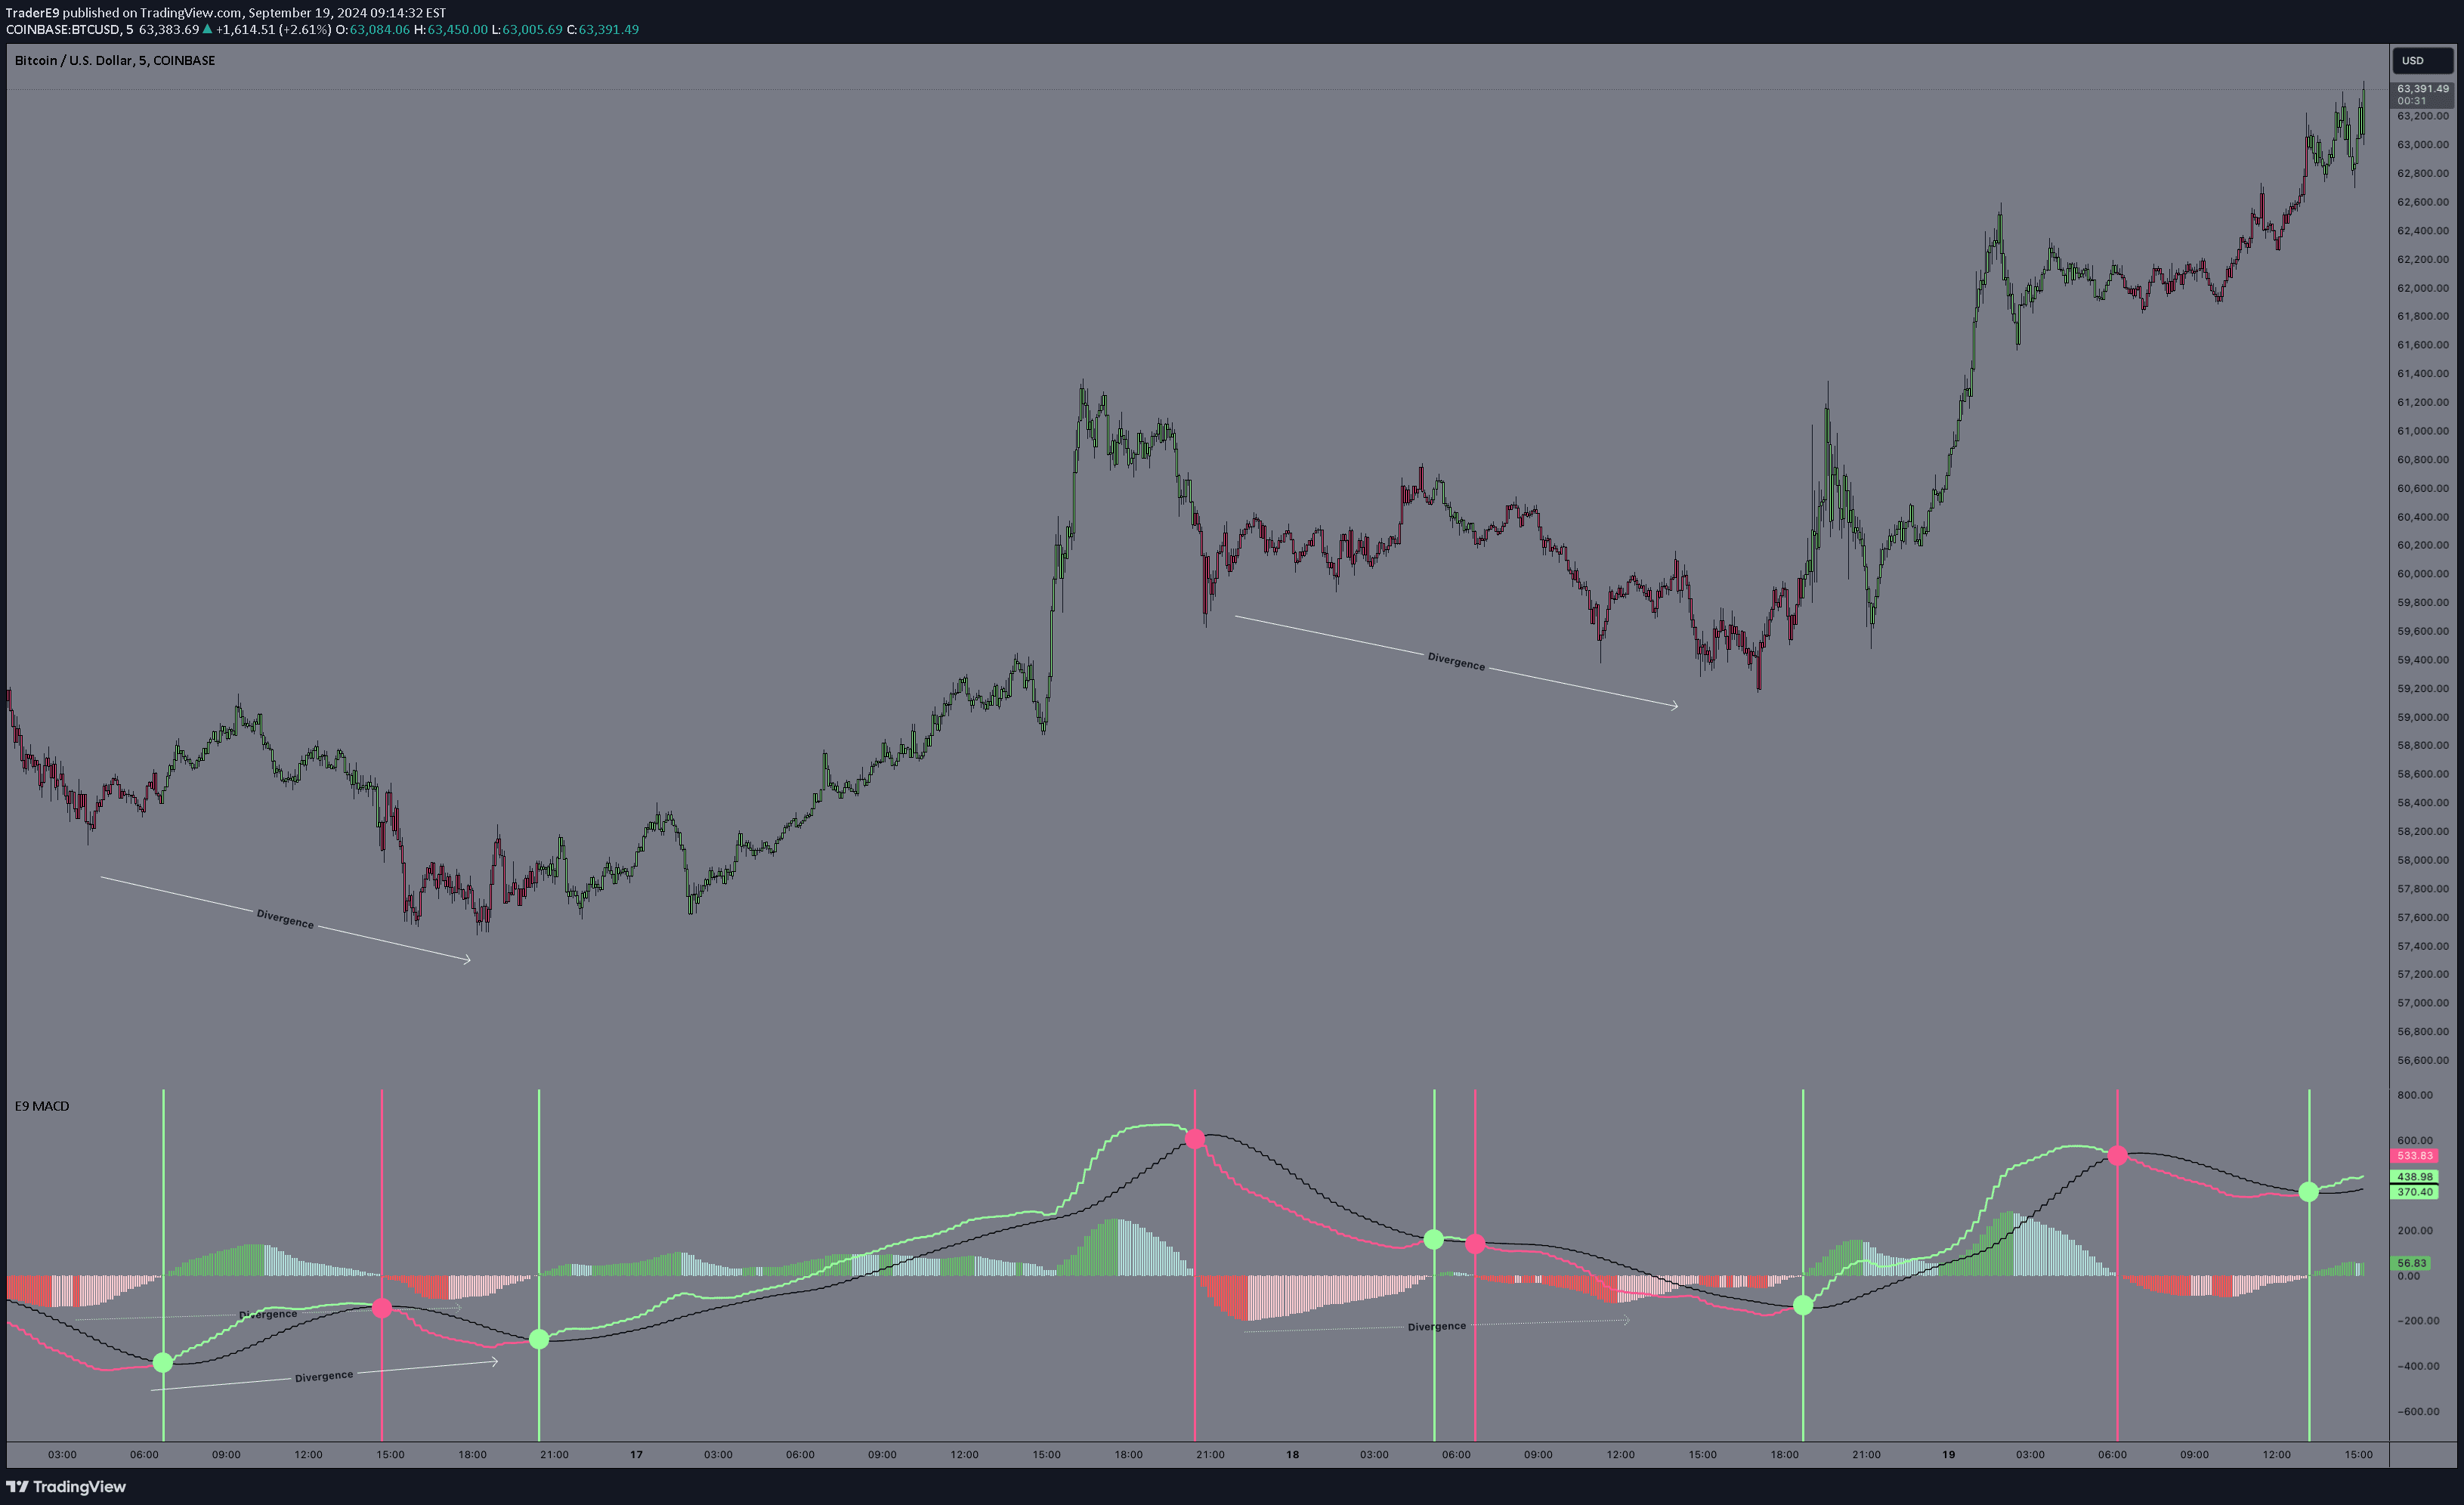
E9 MACD is a technical analysis tool that helps traders identify trend momentum, potential entry and exit points through moving average convergence and divergence analysis.
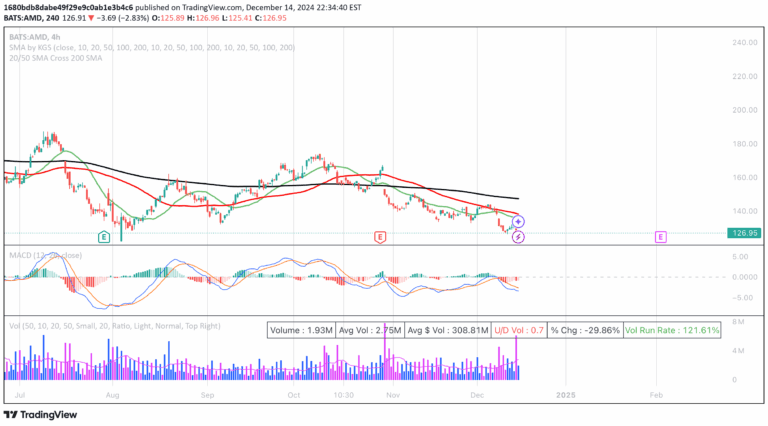
A trading strategy using Simple Moving Averages to detect potential trend changes by monitoring crossovers between 20, 50, and 200-period moving averages.
The E9 Bollinger Range is a technical indicator that tracks price volatility using Bollinger Bands and EMAs to identify potential trading opportunities and trend directions.
Likes, views, and comments are historical TradingView snapshots. They describe attention, not trading performance.