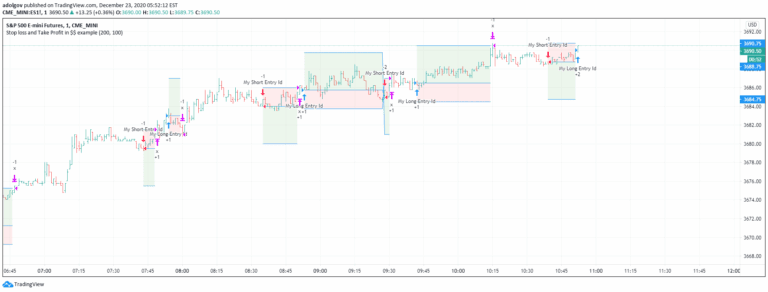
Stop loss and Take Profit in $$ example
A simple exit signal focused on educational purposes, providing traders with a strategic approach to understanding market exit conditions in a specific trading instrument's currency.
Explore 11,183 indicators. Filter beyond the obvious.
Discover the tools that fit the way you trade.
11,183 tools to explore
A simple exit signal focused on educational purposes, providing traders with a strategic approach to understanding market exit conditions in a specific trading instrument's currency.
A trailing exit strategy with multiple profit targets that dynamically adjusts stop loss levels as price moves, designed to optimize trade management and protect potential gains.
A script demonstrating time range backtesting techniques for trading strategies, enabling precise testing of entry and exit points within specific date ranges.
A script exploring how to retrieve historical values from previous candles in different timeframes without using security functions, providing insights into multi-timeframe analysis strategies.
An experimental approach to visualizing RSI performance by mapping its changes across time, creating a unique four-dimensional scatter graph that reveals underlying price and momentum patterns.
A Pine Script method for retrieving financial event data like earnings reports, stock splits, and dividend information using TradingView's inner data representation system.
An indicator that draws higher timeframe OHLC data, demonstrating a structured coding approach with types and methods in TradingView.
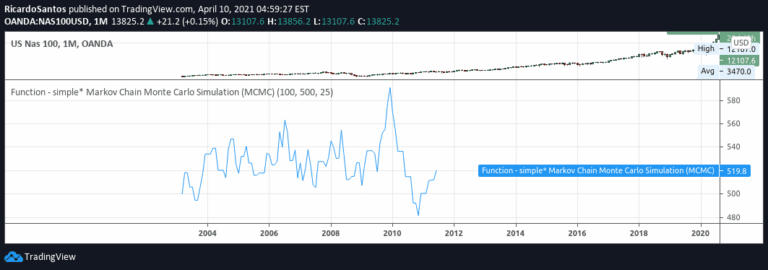
A Monte Carlo Markov Chain simulation is a computational technique used to model complex probabilistic systems and explore potential outcomes through random sampling and statistical analysis.
Fractal Pivots are a unique technical analysis method using Bill Williams' Fractal Theory to identify repetitive price patterns and generate pivot lines across different timeframes.
A custom speedometer visualization tool that converts complex market data like analyst recommendations and put-call ratios into an intuitive graphical representation of market sentiment and trend.
A comprehensive indicator that autogenerates multiple trading levels and gaps across daily, weekly, and monthly timeframes, providing traders with key market insights and potential entry/exit points.
A unique Pine Script™ implementation of Tetris that transforms trading chart into a game environment, demonstrating advanced scripting capabilities and algorithmic decision-making.
Likes, views, and comments are historical TradingView snapshots. They describe attention, not trading performance.