SPY Expected Move by VIX
A volatility indicator using VIX to measure price deviation from VWAP, primarily designed for SPY. It calculates standard deviation moves based on implied volatility, helping traders understand potential price ranges.
Explore 11,183 indicators. Filter beyond the obvious.
Discover the tools that fit the way you trade.
11,183 tools to explore
A volatility indicator using VIX to measure price deviation from VWAP, primarily designed for SPY. It calculates standard deviation moves based on implied volatility, helping traders understand potential price ranges.
Trendilo is a custom TradingView indicator that identifies market trends by analyzing percentage change and using Arnaud Legoux Moving Average with RMS band comparison.
A comprehensive Bitcoin trading model that combines power law trend, rainbow chart, and halving cycle wave to provide insights into potential price movements and market cycles.
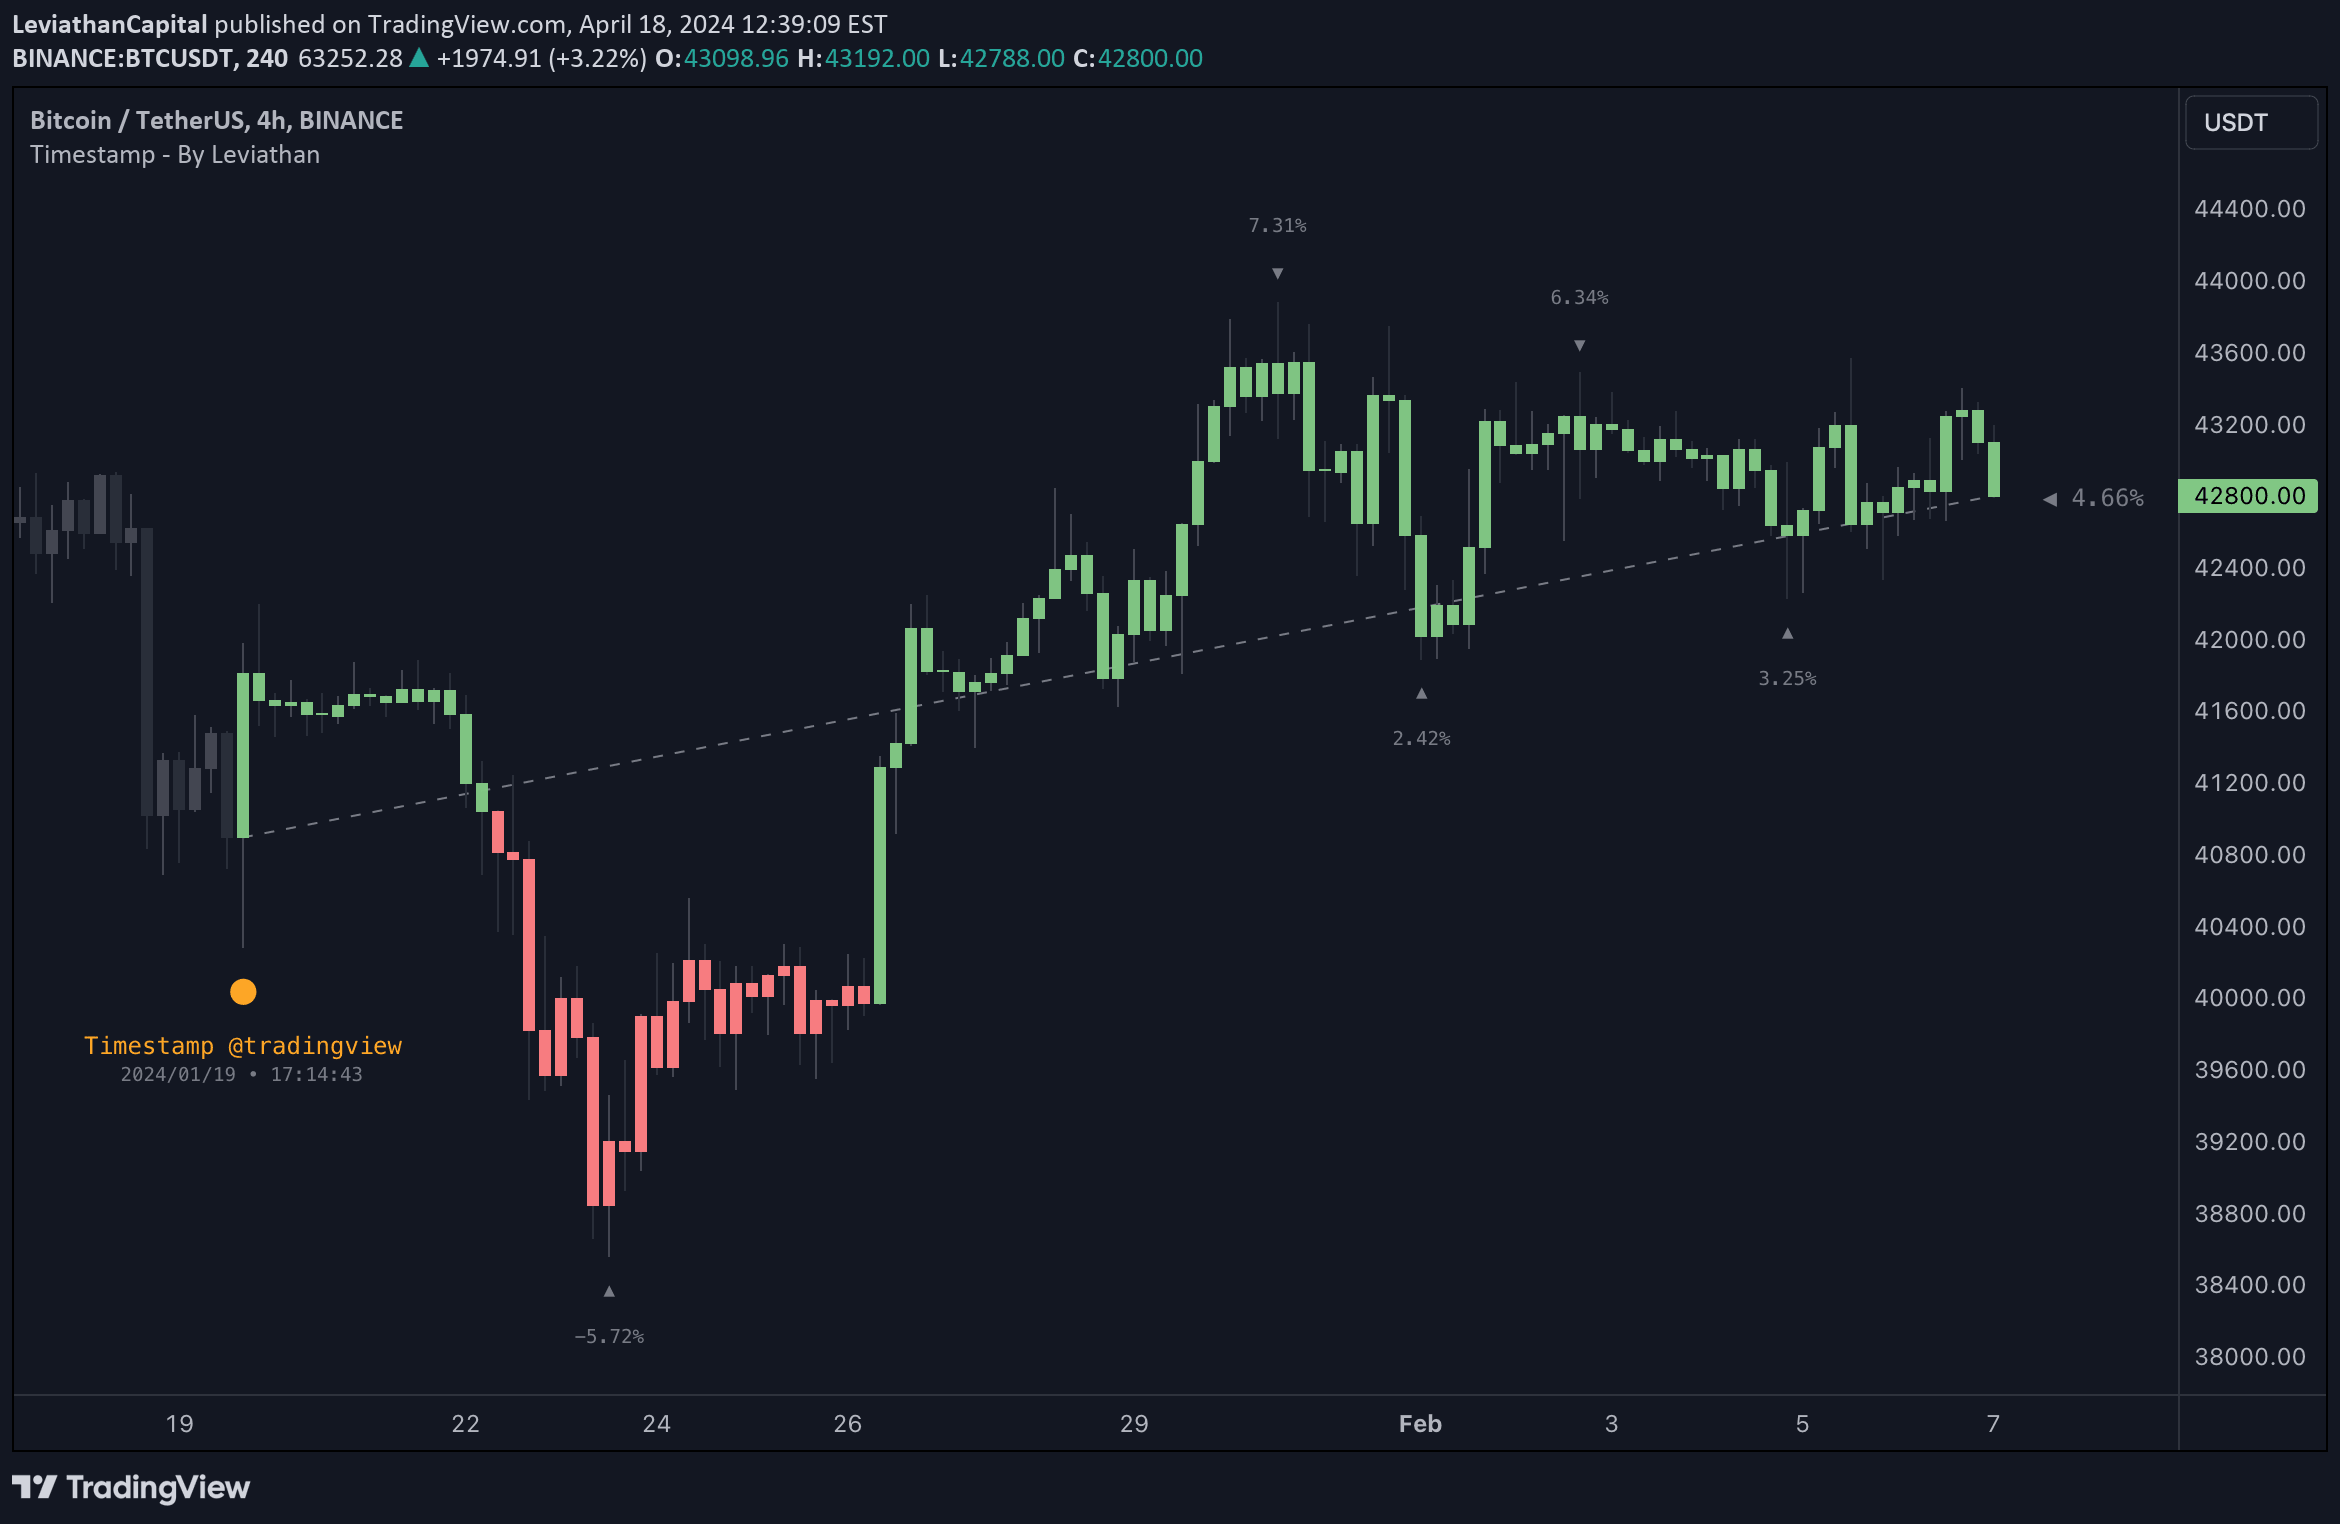
A tool for traders to generate visual timestamps of X/Twitter posts directly on trading charts, aligning social media content with market price actions and events.
A volume indicator that separates trading volume by market session, comparing each session's volume to its historical average to provide context-specific volume analysis.
A straddle strategy analyzing call and put option prices to predict potential market movement within a specific range using technical indicators like Supertrend and EMA.
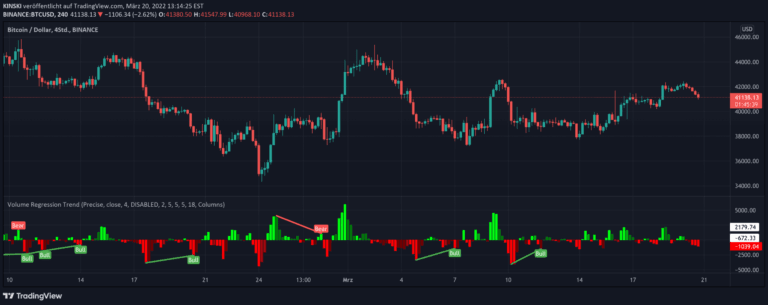
A regression-based indicator that analyzes volume and price trends to determine market direction and strength, offering multiple preset templates for flexible analysis.
A bandpass filter indicator analyzing price motion through 11 spectral filters, enabling traders to predict future price highs and lows using cyclic price components.
Bitcoin Power Law Oscillator analyzes Bitcoin's price relative to a theoretical fair value model, helping investors identify potential market imbalances and mean-reversion opportunities.
A comprehensive money management tool for crypto traders that calculates position sizes, risk, and take-profit targets with precision and discipline.
A volume forecasting indicator that captures periodic volume fluctuations and predicts future trading volume by analyzing historical patterns and intervals.
A logarithmic regression curve for Bitcoin that color codes the price's deviation from its best-fit line, providing visual insight into trend dynamics and potential price extensions.
Likes, views, and comments are historical TradingView snapshots. They describe attention, not trading performance.