Supply and Demand
A technical analysis tool that identifies pivot points in price action to highlight potential supply and demand zones across multiple timeframes for strategic trading decisions.
Explore 11,183 indicators. Filter beyond the obvious.
Discover the tools that fit the way you trade.
11,183 tools to explore
A technical analysis tool that identifies pivot points in price action to highlight potential supply and demand zones across multiple timeframes for strategic trading decisions.
An advanced Fibonacci retracement script offering dual lookback periods for comprehensive market analysis, providing dynamic and customizable support and resistance levels across different timeframes.
A combined trading signal that tracks opening range breakouts and daily/weekly pivot levels to identify potential trading opportunities based on price action around key market levels.
ZVOL transforms raw volume data into a statistically calibrated heatmap using Z-score thresholds, revealing meaningful crowd behavior across different market conditions.
Money Flow Pulse (MFP) is a volume-driven indicator that analyzes price action and volume to reveal the quality and conviction behind market movements across different timeframes.
An advanced Chaikin Money Flow indicator that tracks volume-weighted market momentum and sentiment through color-coded zones and zero-line crossovers.
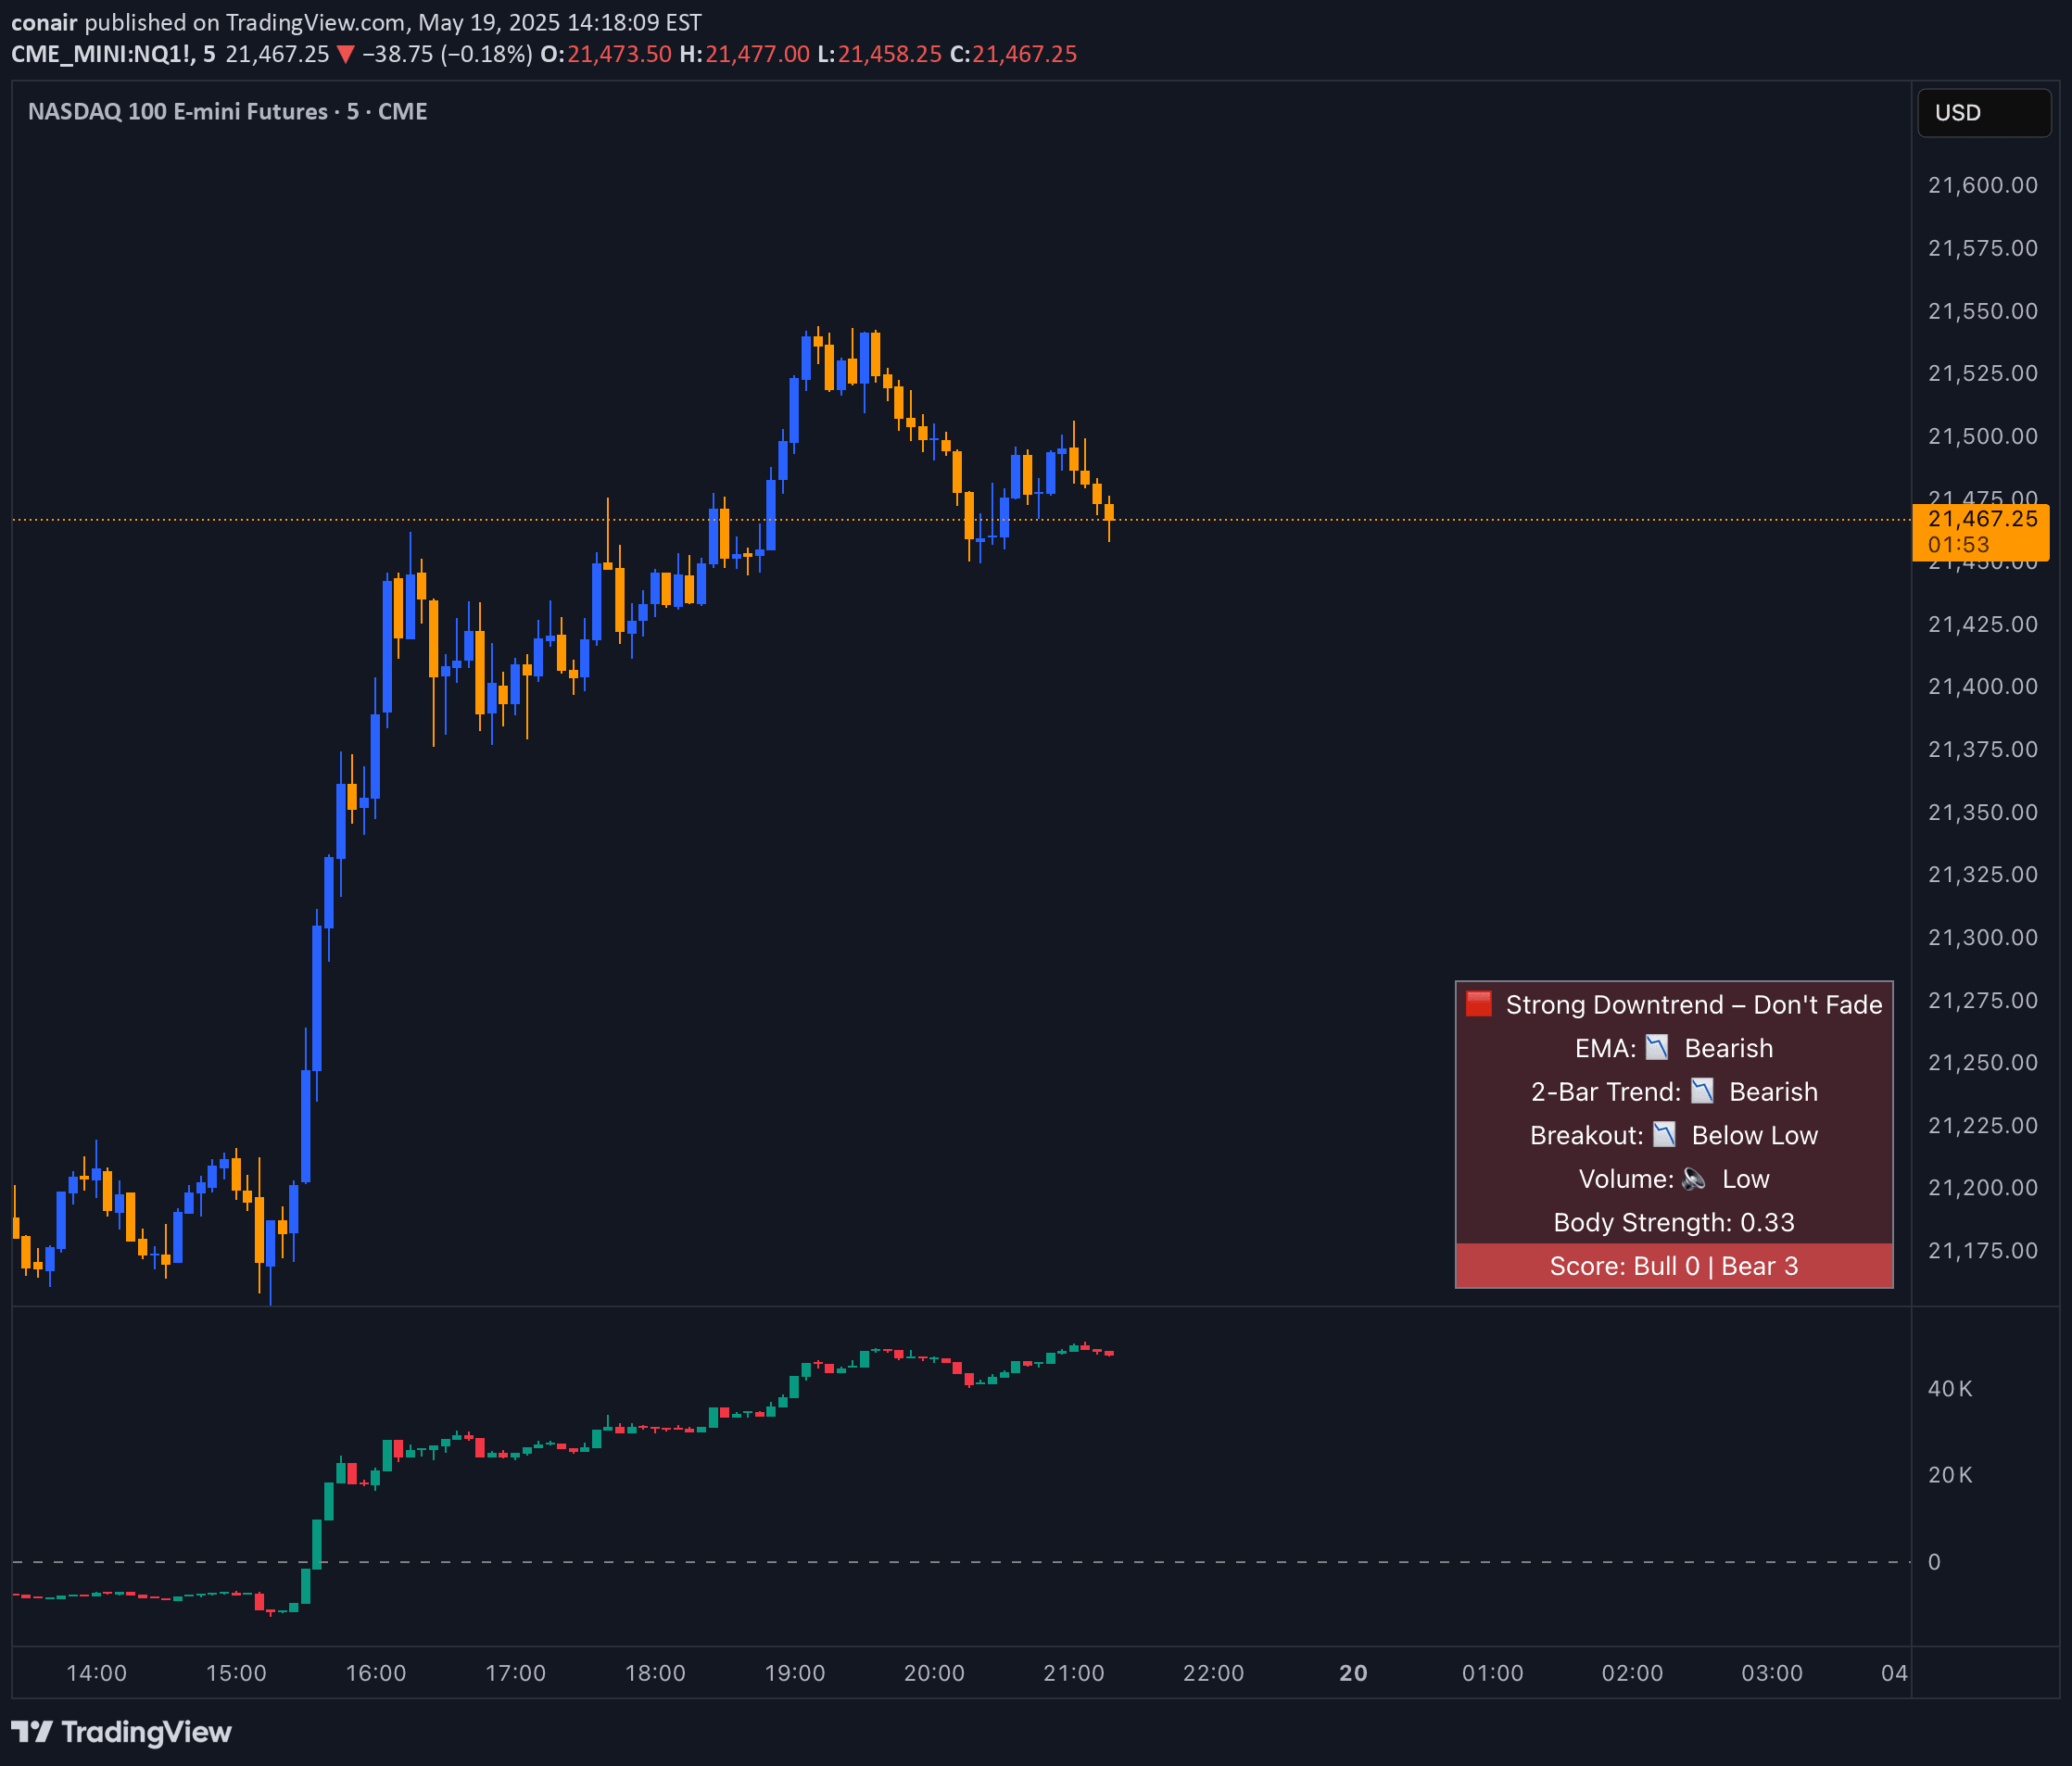
A multi-factor trend confirmation indicator that helps traders avoid fading strong market moves by analyzing price structure, momentum, volume, and trend bias in real-time.
A Rate of Change (ROC) histogram that visualizes price momentum through color-coded bars, highlighting wave pulses and potential trend transitions with responsive, direct momentum tracking.
A tool that automatically identifies and marks High Volume Candles (HVCs) across different timeframes, highlighting key price levels with significant trading activity.
Likes, views, and comments are historical TradingView snapshots. They describe attention, not trading performance.