YOUR INDICATOR RESEARCH STARTS HERE

Find the right indicator.
Understand what it does.

Explore 11,183 indicators. Filter beyond the obvious.
Discover the tools that fit the way you trade.

THE INDICATOR LIBRARY

Results for “first”

11,183 tools to explore

1,151 indicators matching your filters
Save search
TrendVolatilityEditor’s pick

Pivot Point Supertrend

by LonesomeTheBlue

Pivot Point SuperTrend is an advanced trend-following indicator that combines pivot points with SuperTrend to generate more reliable trading signals and identify potential trend reversals.

Main price chartDay Trading · Swing Trading
Explore
21.7Klikes714Kviews217comments
Save
TrendMomentumEditor’s pick

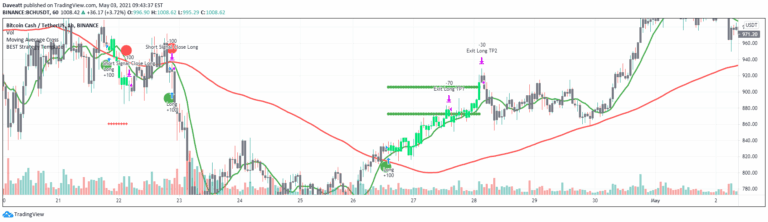
Ultimate Strategy Template

by Daveatt

A universal strategy template for TradingView that allows traders to convert any indicator into a tradable strategy with comprehensive risk management and backtesting features.

Main price chart · unverifiedDay Trading · Swing Trading
Explore
10.5Klikes237Kviews274comments
Save
TrendVolatilityEditor’s pick

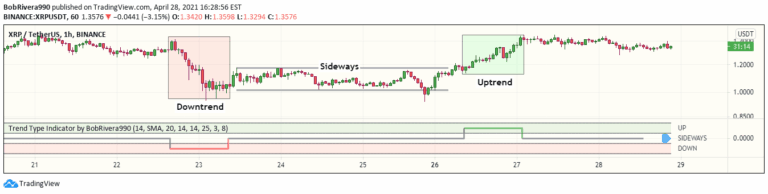
Trend Type Indicator by BobRivera990

by BobRivera990

A technical analysis signal that uses ATR and ADX to detect market trends, distinguishing between uptrend, downtrend, and sideways movements by analyzing price volatility and directional momentum.

Separate pane · unverifiedSwing Trading
Explore
10.3Klikes285.2Kviews136comments
Save
LevelsSignal

Liquidity Sweeps [LuxAlgo]

by LuxAlgo

A trading indicator that detects liquidity sweeps by identifying price breaks through key liquidity levels, highlighting potential support/resistance zones and entry opportunities.

Main price chart · unverifiedScalping · Day Trading
Explore
8Klikes224.1Kviews25comments
Save
PatternsSignalTrend

Three Bar Reversal Pattern [LuxAlgo]

by LuxAlgo

A technical analysis indicator that identifies three-bar reversal patterns, helping traders detect potential trend changes by analyzing consecutive price bar formations and their relationships.

Main price chart · unverifiedScalping · Day Trading
Explore
7.7Klikes90.2Kviews19comments
Save
TrendMomentum

Heikin Ashi RSI Oscillator

by JayRogers

HARSI is a unique oscillator combining Heikin Ashi candles with RSI calculations, designed to reduce noise and provide smoother trend analysis for traders.

Separate pane · unverifiedDay Trading · Swing Trading
Explore
7.6Klikes318Kviews178comments
Save
LevelsSignalTrend

ICT Turtle Soup | Flux Charts

by fluxchart

An advanced trading indicator implementing the ICT Turtle Soup strategy, which identifies liquidity zones and market structure shifts to generate precise entry and exit signals for traders.

Main price chart · unverifiedScalping · Day Trading
Explore
6Klikes127.1Kviews34comments
Save
LevelsTrend

Fibonacci Trend [ChartPrime]

by ChartPrime

A dynamic trading indicator combining supertrend analysis with Fibonacci levels to identify market direction, support/resistance zones, and potential entry points.

Main price chart · unverifiedScalping · Day Trading
Explore
5.9Klikes93.3Kviews20comments
Save
SignalLevels

FVG Sessions [LuxAlgo]

by LuxAlgo

A trading indicator that identifies the first fair value gap in a trading session, highlighting price imbalances and potential support/resistance zones with customized alerts.

Main price chart · unverifiedScalping · Day Trading
Explore
5.6Klikes223.8Kviews22comments
Save
SignalTrend

ORB Algo | Flux Charts

by fluxchart

An advanced Opening Range Breakout (ORB) indicator that analyzes market trends in the first session minutes, providing precise entry, take-profit, and stop-loss signals.

Main price chart · unverifiedScalping · Day Trading
Explore
5.5Klikes146.3Kviews87comments
Save

Likes, views, and comments are historical TradingView snapshots. They describe attention, not trading performance.

START WITH A QUESTION

A little less searching.
A lot more understanding.

Tell DeepAlpha what you need. Get an explanation, a shortlist,
and a direct path to the indicators behind it.

Ask DeepAlpha