YOUR INDICATOR RESEARCH STARTS HERE

Find the right indicator.
Understand what it does.

Explore 11,183 indicators. Filter beyond the obvious.
Discover the tools that fit the way you trade.

THE INDICATOR LIBRARY

Results for “gains”

11,183 tools to explore

129 indicators matching your filters
Save search
MomentumTrend

RS Rating

by Fred6724

The RS Rating evaluates a stock's price performance relative to the market over 52 weeks, helping traders identify stocks that are outperforming and potentially poised for further gains.

Separate pane · unverifiedDay Trading · Swing Trading
Explore
3.4Klikes45.4Kviews223comments
Save
TrendMomentumEditor’s pick

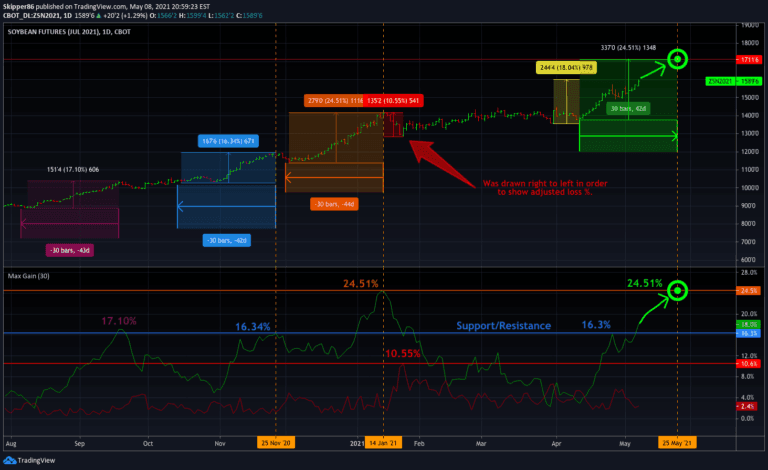
Max Gain

by Skipper86

A trading indicator that calculates potential price targets by analyzing percentage gains and losses over a specified time period, helping traders identify potential resistance levels and performance targets.

Separate pane · unverifiedSwing Trading
Explore
3.1Klikes60Kviews15comments
Save
TrendEditor’s pick

Stepped trailing strategy example

by adolgov

A trailing exit strategy with multiple profit targets that dynamically adjusts stop loss levels as price moves, designed to optimize trade management and protect potential gains.

Main price chart · unverifiedSwing Trading
Explore
2.6Klikes55.3Kviews52comments
Save
Risk ManagementSignal

Lot Size & Risk Calculator (All Pairs)

by Algoryze

An advanced trading tool that automatically calculates lot sizes, manages risk, and visualizes key trading levels for precise and consistent trade execution across multiple assets.

Main price chart · unverifiedScalping · Day Trading
Explore
1.7Klikes18.4Kviews3comments
Save
TrendMomentumEditor’s pick

Traling.SL.Target

by Sharad_Gaikwad

A trading strategy implementing dynamic trailing stop-loss and target mechanisms using percentage or fixed point-based calculations to manage trade entries and exits.

Main price chart · unverifiedDay Trading · Swing Trading
Explore
1.3Klikes62.3Kviews21comments
Save
Editor’s pick

RedK Portfolio Tracker [Table Version]

by RedKTrader

A real-time portfolio tracking tool in TradingView that allows traders to monitor up to 10 holdings and cash position, providing visual insights into investment performance directly on the chart.

Main price chart · unverifiedDay Trading · Swing Trading
Explore
1.2Klikes49.1Kviews37comments
Save
VolatilityEditor’s pick

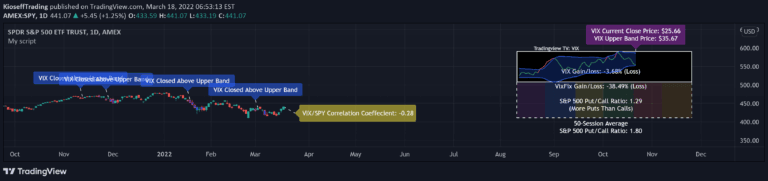
VIX Cheat Sheet

by KioseffTrading

A VIX-based indicator that analyzes volatility correlation with asset prices, tracking VIX/VixFix movements and calculating potential market performance after specific volatility conditions.

Main price chart · unverifiedDay Trading · Swing Trading
Explore
1.1Klikes65.5Kviews32comments
Save

Likes, views, and comments are historical TradingView snapshots. They describe attention, not trading performance.

START WITH A QUESTION

A little less searching.
A lot more understanding.

Tell DeepAlpha what you need. Get an explanation, a shortlist,
and a direct path to the indicators behind it.

Ask DeepAlpha