
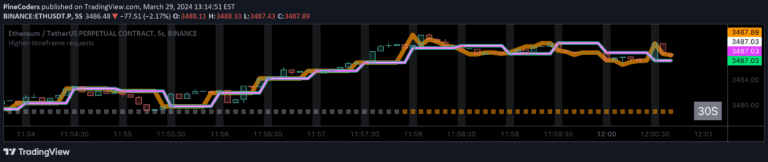
Higher-timeframe requests
A comprehensive guide to accessing higher-timeframe data using request.security() function while preventing repainting, offering multiple non-repainting techniques for more reliable trading signals.
Explore 11,183 indicators. Filter beyond the obvious.
Discover the tools that fit the way you trade.
11,183 tools to explore
A comprehensive guide to accessing higher-timeframe data using request.security() function while preventing repainting, offering multiple non-repainting techniques for more reliable trading signals.
A fair value gap (FVG) indicator identifies price imbalances between market participants by analyzing multi-timeframe candle patterns and highlighting potential trading opportunities.
Advanced multi-signal trading tool combining power candle detection, breakout identification, and smart volatility-based risk placement for precision market analysis.
A multi-timeframe trend tracking tool using Exponential Moving Averages (EMAs) to detect trend direction, strength, and momentum across seven different timeframes.
A price deviation indicator that calculates and visualizes multiple levels from a timeframe's opening price, helping traders identify potential support, resistance, and trend strength zones.
An advanced trading indicator that automatically tracks and displays daily and weekly price levels, helping traders identify key support and resistance zones across multiple timeframes.
A trading indicator identifying higher-timeframe Fair Value Gaps (FVG) as potential order blocks, helping traders spot institutional trading zones and price imbalances across different timeframes.
A momentum-based breakout signal that identifies trend continuation by detecting when a green candle closes above the 5-day Simple Moving Average for the first time after being below it.
A price action strategy that identifies structured trading opportunities using momentum shifts, volume analysis, and breakout confirmations across multiple market conditions.
A trading indicator combining pivot levels and Money Flow Index to generate systematic trade entries, manage positions, and visualize market momentum through dynamic candle opacity.
A multiple timeframe levels indicator that plots high, low, and midpoint lines across different time horizons to help traders identify key support and resistance zones.
A comprehensive moving average tool allowing traders to plot up to 10 customizable moving averages with multiple parameters and display styles across different timeframes.
Likes, views, and comments are historical TradingView snapshots. They describe attention, not trading performance.